________________
31-63/2, 3901-19 2010
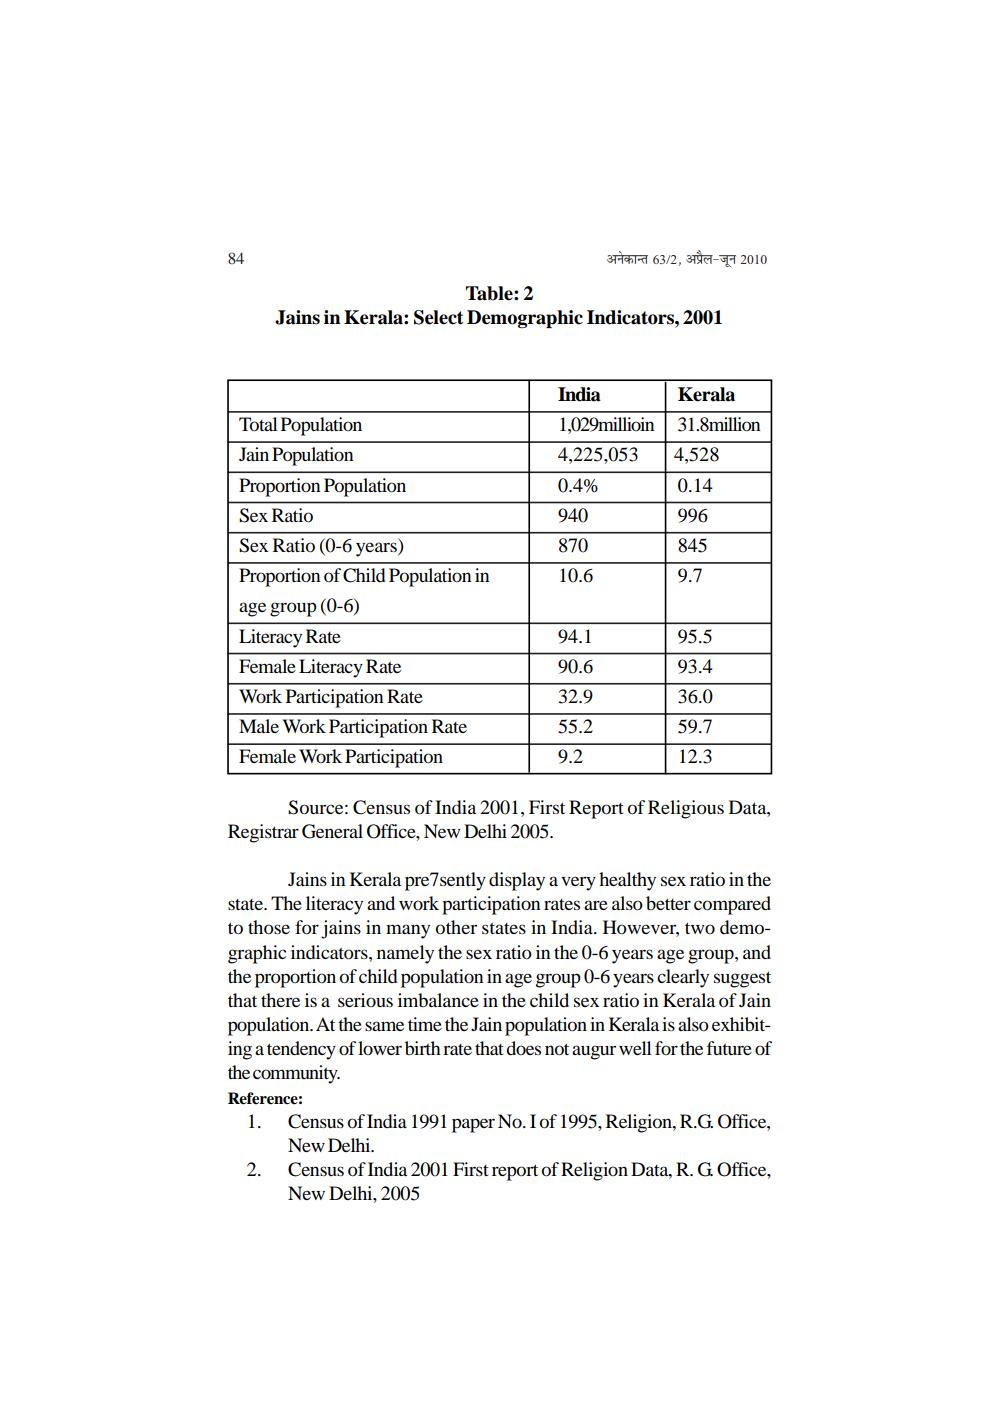
Table: 2 Jains in Kerala: Select Demographic Indicators, 2001
India 1,029millioin 4,225,053 0.4%
Kerala 31.8million 4,528 0.14 996 845 9.7
940
870 10.6
Total Population Jain Population Proportion Population Sex Ratio Sex Ratio (0-6 years) Proportion of Child Population in age group (0-6) Literacy Rate Female Literacy Rate Work Participation Rate Male Work Participation Rate Female Work Participation
95.5 93.4
94.1 90.6 32.9 55.2 9.2
36.0
59.7 12.3
Source: Census of India 2001, First Report of Religious Data, Registrar General Office, New Delhi 2005.
Jains in Kerala pre7sently display a very healthy sex ratio in the state. The literacy and work participation rates are also better compared to those for jains in many other states in India. However, two demographic indicators, namely the sex ratio in the 0-6 years age group, and the proportion of child population in age group 0-6 years clearly suggest that there is a serious imbalance in the child sex ratio in Kerala of Jain population. At the same time the Jain population in Kerala is also exhibiting a tendency of lower birth rate that does not augur well for the future of the community. Reference: 1. Census of India 1991 paper No. I of 1995, Religion, R.G. Office,
New Delhi. 2. Census of India 2001 First report of Religion Data, R. G. Office,
New Delhi, 2005