Book Title: ISJS Jainism Study Notes E5 Vol 04
Author(s): International School for Jain Studies
Publisher: International School for Jain Studies
View full book text
________________
Gujaratis "A statistical profile of the Jaina community given in the 1986 Directory of Jainas shows that the majority of the respondents were either engineers (33.1%) or in the medical field (19.8%); even though Jainas are known as businessmen in India, a small percentage (12.1%) are self-employed in the United States" (Williams 1988: 64). By 1990s the population of Jainas in the U.S. had increased to about 50,000 and presently it is estimated at 100,000. Most Jainas in the U.S. live in nine states. These are in order of population density) New York, California, New Jersey, Michigan, Texas, Illinois, Ohio, Maryland and Massachusetts.
By the mid-1990s there were 55 Jaina socio-cultural associations/societies/centers in the U.S. catering to a wide variety of community needs. Today their number has gone well over 110. To further co-ordinate the activities of these associations the Federation of Jain Associations in North America was formed in 1981 "which had more than 6,000 participants in their ninth biannual convention in 1997" (Shah 1998: 82).
4.5 Canada In the case of Canada it is difficult to say who migrated first to Canada and when. In all probability the first Jainas must have migrated to Canada after India's independence, particularly from the 1950s onwards. Since then a large number of Jainas have migrated to Canada first under the Quota system and subsequently under the Point system. These were joined by a small number of East African Jaina refugees who were expelled from Uganda by Idi Amin Dada in 1972. In the early 1990s the Jaina population of Canada was estimated at about 10,000 (Kumar 1996). According to the same source all Canadian provinces except Saskatchewan, Prince Edward Island, Yukon and North West Territories, had Jain residents. Ontario was the host to the majority of Jains followed by Quebec and British Columbia. This trend of geographical distribution still holds good. As in the U.S., in Canada too a majority of Jains reside in urban and industrial centers and happen to be professionals.
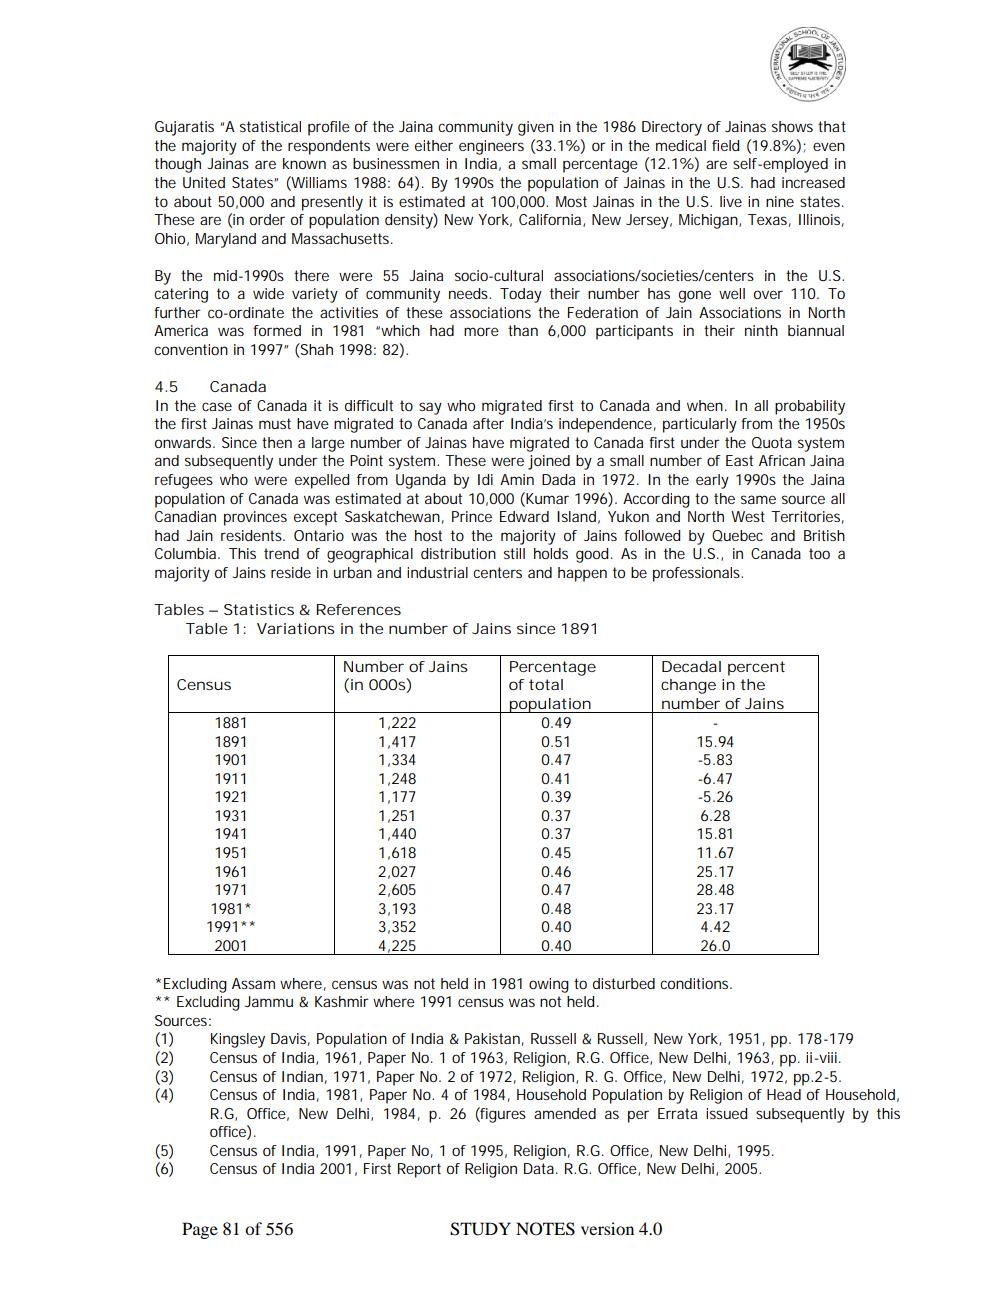
Tables - Statistics & References
Table 1: Variations in the number of Jains since 1891
Census
Number of Jains (in 000s)
Decadal percent change in the number of Jains
Percentage of total population
0.49 0.51 0.47 0.41
0.39
1881 1891 1901 1911 1921 1931 1941 1951 1961 1971 1981* 1991** 2001
1,222 1,417 1,334 1,248 1,177 1,251 1,440 1,618 2,027 2,605 3,193 3,352 4,225
0.37 0.37 0.45
15.94 -5.83 -6.47 -5.26 6.28 15.81 11.67 25.17 28.48 23.17 4.42 26.0
0.46
0.47 0.48 0.40 0.40
(2)
*Excluding Assam where, census was not held in 1981 owing to disturbed conditions. ** Excluding Jammu & Kashmir where 1991 census was not held. Sources: (1) Kingsley Davis, Population of India & Pakistan, Russell & Russell, New York, 1951, pp. 178-179
Census of India, 1961, Paper No. 1 of 1963, Religion, R.G. Office, New Delhi, 1963, pp. ii-viii.
Census of Indian, 1971, Paper No. 2 of 1972, Religion, R. G. Office, New Delhi, 1972, pp.2-5 (4) Census of India, 1981, Paper No. 4 of 1984, Household Population by Religion of Head of Household,
RG, Office, New Delhi, 1984, p. 26 (figures amended as per Errata issued subsequently by this office) Census of India, 1991, Paper No, 1 of 1995, Religion, R.G. Office, New Delhi, 1995. Census of India 2001, First Report of Religion Data. R.G. Office, New Delhi, 2005.
Page 81 of 556
STUDY NOTES version 4.0