________________
Shri Ashtapad Maha Tirth - II
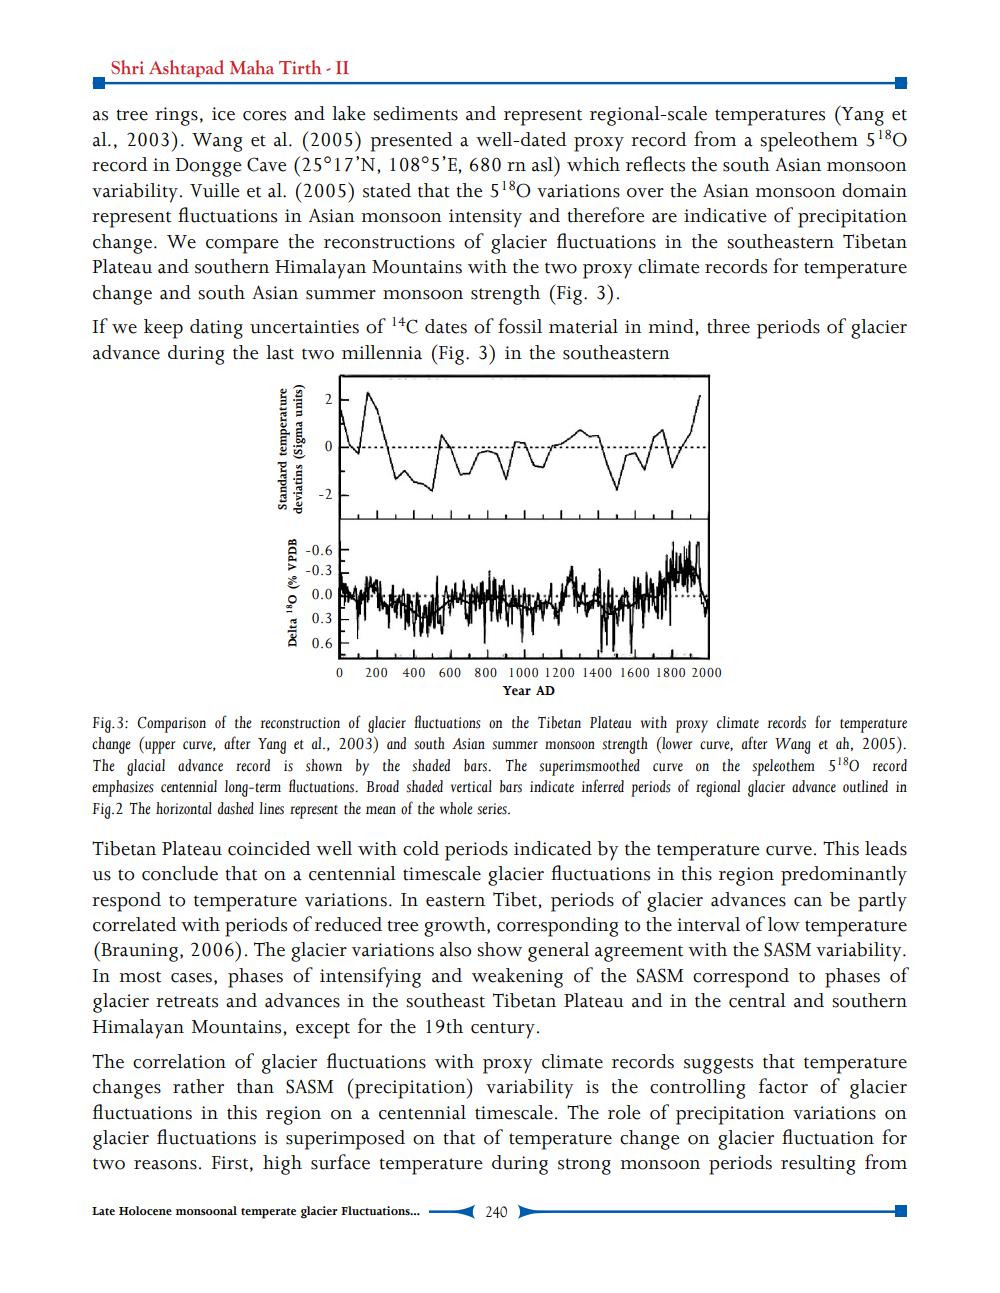
as tree rings, ice cores and lake sediments and represent regional-scale temperatures (Yang et al., 2003). Wang et al. (2005) presented a well-dated proxy record from a speleothem 510 record in Dongge Cave (25°17'N, 108°5'E, 680 rn asl) which reflects the south Asian monsoon variability. Vuille et al. (2005) stated that the 5180 variations over the Asian monsoon domain represent fluctuations in Asian monsoon intensity and therefore are indicative of precipitation change. We compare the reconstructions of glacier fluctuations in the southeastern Tibetan Plateau and southern Himalayan Mountains with the two proxy climate records for temperature change and south Asian summer monsoon strength (Fig. 3).
If we keep dating uncertainties of 4C dates of fossil material in mind, three periods of glacier advance during the last two millennia (Fig. 3) in the southeastern
www
W
Standard temperature deviatins (Sigma units)
Delta 180 (% VPDB
0
-0.6
-0.3
0.0
0.3
0.6
0 200 400 600 800 1000 1200 1400 1600 1800 2000
Year AD
Fig.3: Comparison of the reconstruction of glacier fluctuations on the Tibetan Plateau with proxy climate records for temperature change (upper curve, after Yang et al., 2003) and south Asian summer monsoon strength (lower curve, after Wang et ah, 2005). The glacial advance record is shown by the shaded bars. The superimsmoothed curve on the speleothem 5180 record emphasizes centennial long-term fluctuations. Broad shaded vertical bars indicate inferred periods of regional glacier advance outlined in Fig.2 The horizontal dashed lines represent the mean of the whole series.
Tibetan Plateau coincided well with cold periods indicated by the temperature curve. This leads us to conclude that on a centennial timescale glacier fluctuations in this region predominantly respond to temperature variations. In eastern Tibet, periods of glacier advances can be partly correlated with periods of reduced tree growth, corresponding to the interval of low temperature (Brauning, 2006). The glacier variations also show general agreement with the SASM variability. In most cases, phases of intensifying and weakening of the SASM correspond to phases of glacier retreats and advances in the southeast Tibetan Plateau and in the central and southern Himalayan Mountains, except for the 19th century.
The correlation of glacier fluctuations with proxy climate records suggests that temperature changes rather than SASM (precipitation) variability is the controlling factor of glacier fluctuations in this region on a centennial timescale. The role of precipitation variations on glacier fluctuations is superimposed on that of temperature change on glacier fluctuation for two reasons. First, high surface temperature during strong monsoon periods resulting from
Late Holocene monsoonal temperate glacier Fluctuations...
240