________________
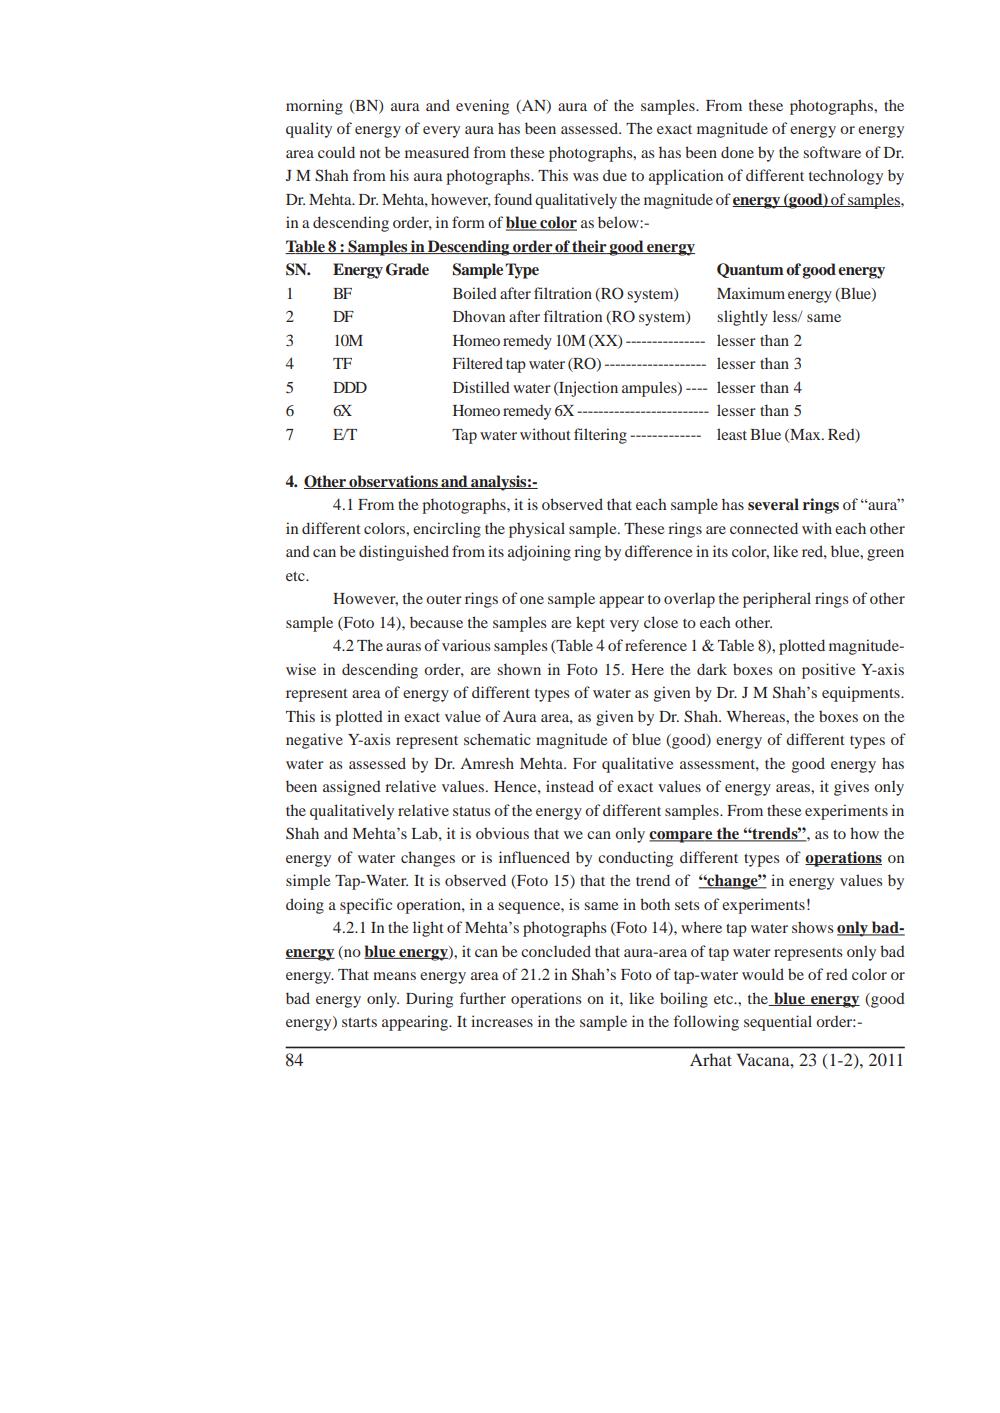
morning (BN) aura and evening (AN) aura of the samples. From these photographs, the quality of energy of every aura has been assessed. The exact magnitude of energy or energy area could not be measured from these photographs, as has been done by the software of Dr. JM Shah from his aura photographs. This was due to application of different technology by Dr. Mehta. Dr. Mehta, however, found qualitatively the magnitude of energy (good) of samples, in a descending order, in form of blue color as below:
Table 8: Samples in Descending order of their good energy Energy Grade Sample Type
SN.
Boiled after filtration (RO system) Dhovan after filtration (RO system) Homeo remedy 10M (XX)--
Filtered tap water (RO) -
1
2
3
4
5
6
7
BF
DF
10M
TF
DDD
6X
E/T
84
Quantum of good energy Maximum energy (Blue) slightly less/ same
lesser than 2
lesser than 3
Distilled water (Injection ampules) ---- lesser than 4 Homeo remedy 6X---- lesser than 5
Tap water without filtering
least Blue (Max. Red)
4. Other observations and analysis:
4.1 From the photographs, it is observed that each sample has several rings of "aura" in different colors, encircling the physical sample. These rings are connected with each other and can be distinguished from its adjoining ring by difference in its color, like red, blue, green etc.
However, the outer rings of one sample appear to overlap the peripheral rings of other sample (Foto 14), because the samples are kept very close to each other.
4.2 The auras of various samples (Table 4 of reference 1 & Table 8), plotted magnitudewise in descending order, are shown in Foto 15. Here the dark boxes on positive Y-axis represent area of energy of different types of water as given by Dr. J M Shah's equipments. This is plotted in exact value of Aura area, as given by Dr. Shah. Whereas, the boxes on the negative Y-axis represent schematic magnitude of blue (good) energy of different types of water as assessed by Dr. Amresh Mehta. For qualitative assessment, the good energy has been assigned relative values. Hence, instead of exact values of energy areas, it gives only the qualitatively relative status of the energy of different samples. From these experiments in Shah and Mehta's Lab, it is obvious that we can only compare the "trends", as to how the energy of water changes or is influenced by conducting different types of operations on simple Tap-Water. It is observed (Foto 15) that the trend of "change" in energy values by doing a specific operation, in a sequence, is same in both sets of experiments!
4.2.1 In the light of Mehta's photographs (Foto 14), where tap water shows only badenergy (no blue energy), it can be concluded that aura-area of tap water represents only bad energy. That means energy area of 21.2 in Shah's Foto of tap-water would be of red color or bad energy only. During further operations on it, like boiling etc., the blue energy (good energy) starts appearing. It increases in the sample in the following sequential order:
Arhat Vacana, 23 (1-2), 2011