________________
There is a slight decrease in wall percentage with respect to the overall temple area during the construction of the first temple to the latest. Samosaran Temple, Pawapuri has least wall area percentage (3.07%), while Sri Muni suvaratswami Mukhya Jinalaya, Vaibhargiri has the highest wall area percentage (36.93%). the reason behind the least wall percentage (3.07%) for Samosaran Temple, Pawapuri is, it is an open circular auditorium temple. It is symbolic temple represented as the Tirthankar giving sermon to the gathering. Slight decrease in graph trend is due to use of modern material and technology. The average value 19.86% indicates the common value for the religious building constructed in India. Which indicate uses of the uniform building material and technology in all types of religious building in India (Vardia, 2008).
Length - Width Ratio of Temples
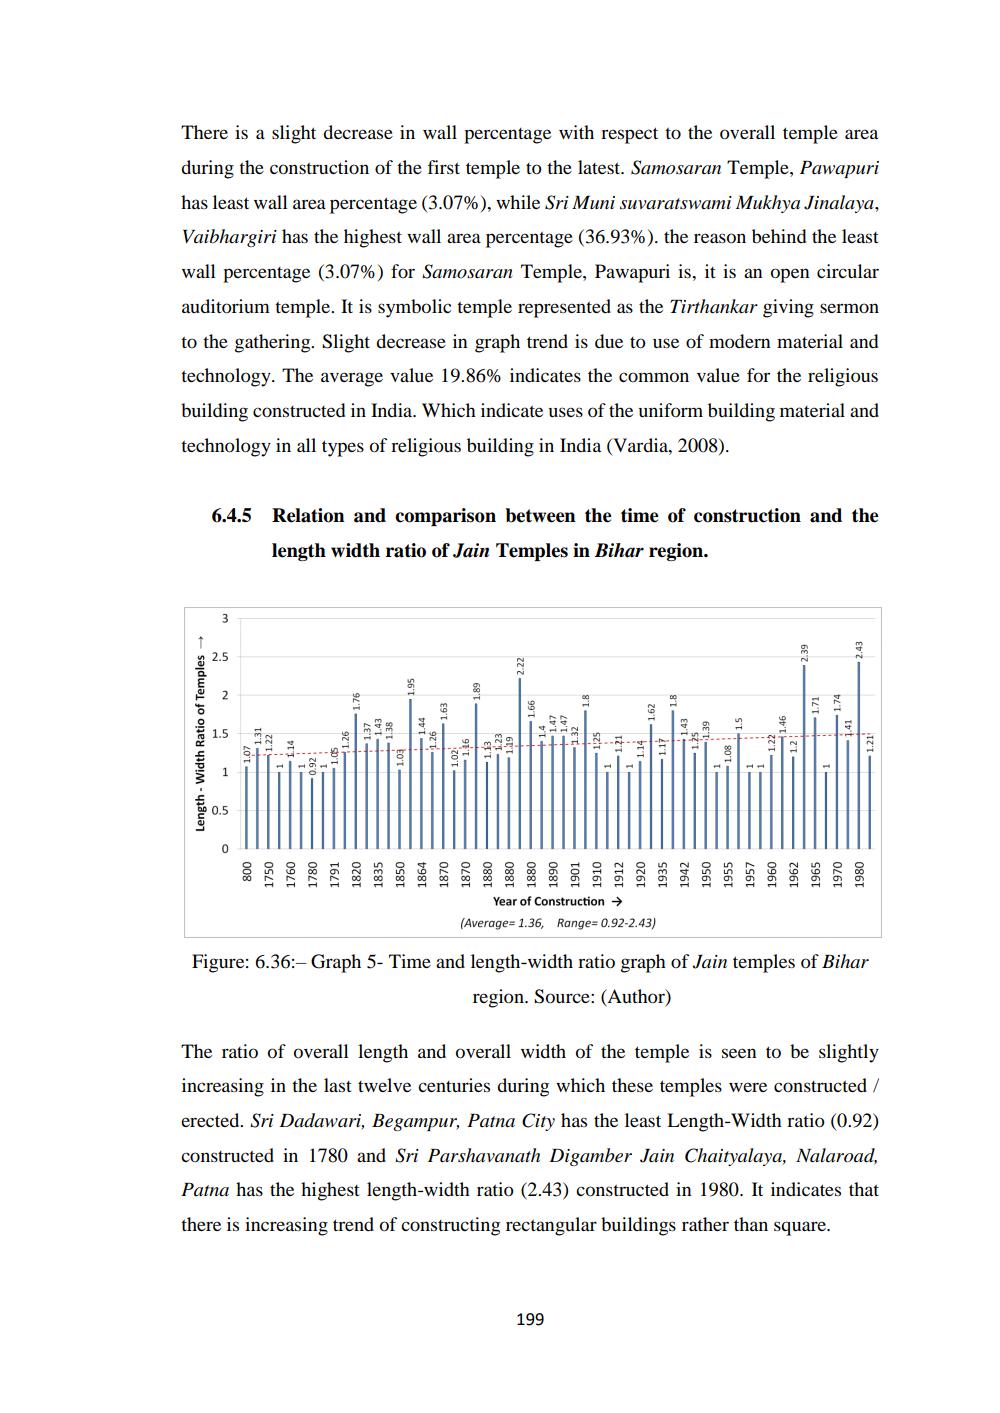
6.4.5 Relation and comparison between the time of construction and the length width ratio of Jain Temples in Bihar region.
3
2.5
2
1.5
0.5
1750
09/1
1780
1791
1820
1835
осят
1864
1870
1870
1880
121
1880
1890
1901
1910
1912
1920
1935
1942
1950
1955
1957
Year of Construction →
(Average=1.36, Range=0.92-2.43)
096T
199
1962
596T
1970
1980
Figure: 6.36:- Graph 5- Time and length-width ratio graph of Jain temples of Bihar
region. Source: (Author)
The ratio of overall length and overall width of the temple is seen to be slightly increasing in the last twelve centuries during which these temples were constructed/ erected. Sri Dadawari, Begampur, Patna City has the least Length-Width ratio (0.92) constructed in 1780 and Sri Parshavanath Digamber Jain Chaityalaya, Nalaroad, Patna has the highest length-width ratio (2.43) constructed in 1980. It indicates that there is increasing trend of constructing rectangular buildings rather than square.