________________
6.4.6
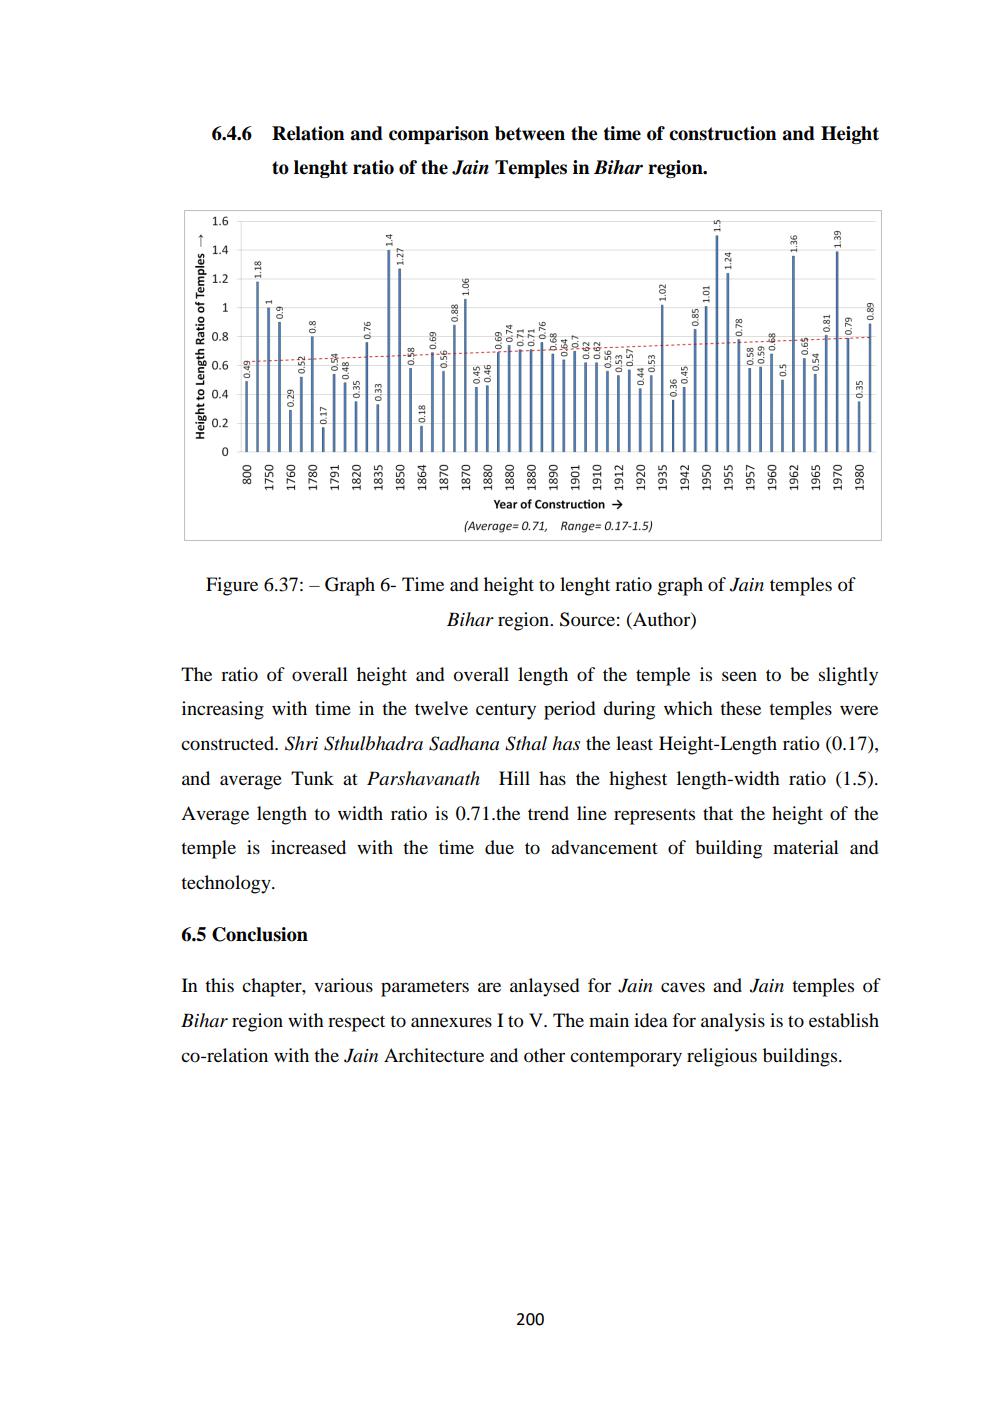
Relation and comparison between the time of construction and Height to lenght ratio of the Jain Temples in Bihar region.
1.36
139
1.18
1.06
1.01
To
880
0.89
S80
0.76
Height to Length Ratio of Temples →
0.74
0.79
0.69 -0.58
-0.69
0.71
0.76 40.71
0.68 0.64
0.7 0.62 -0.62
0.78
0.68 -0.58 -0.59 0.5
+0.81 -0.65 0.54
0.52
-0.56
-0.56
: 0.54
0.48 0.35 0,33
0.53
-0.57: 0.44 -0.53
-0.45
0.46
0.45
0.29
HHHHHHHHHHHH
980
IIIIIIIIII
-0.35
-0.17
0.18
HHHHHHHHHHHHHH LLLLLLLLLLLLL
800 1750 1760 1780 1791 1820 1835 1850 1864 1870
1935 1942 1950 1955 1957
1960 1962 1965 1970 1980
Year of Construction → (Average=0.71, Range= 0.17-1.5)
Figure 6.37:- Graph 6- Time and height to lenght ratio graph of Jain temples of
Bihar region. Source: (Author)
The ratio of overall height and overall length of the temple is seen to be slightly increasing with time in the twelve century period during which these temples were constructed. Shri Sthulbhadra Sadhana Sthal has the least Height-Length ratio (0.17), and average Tunk at Parshavanath Hill has the highest length-width ratio (1.5). Average length to width ratio is 0.71.the trend line represents that the height of the temple is increased with the time due to advancement of building material and technology.
6.5 Conclusion
In this chapter, various parameters are anlaysed for Jain caves and Jain temples of Bihar region with respect to annexures I to V. The main idea for analysis is to establish co-relation with the Jain Architecture and other contemporary religious buildings.
200