________________
Height of Temple (in Metre) →
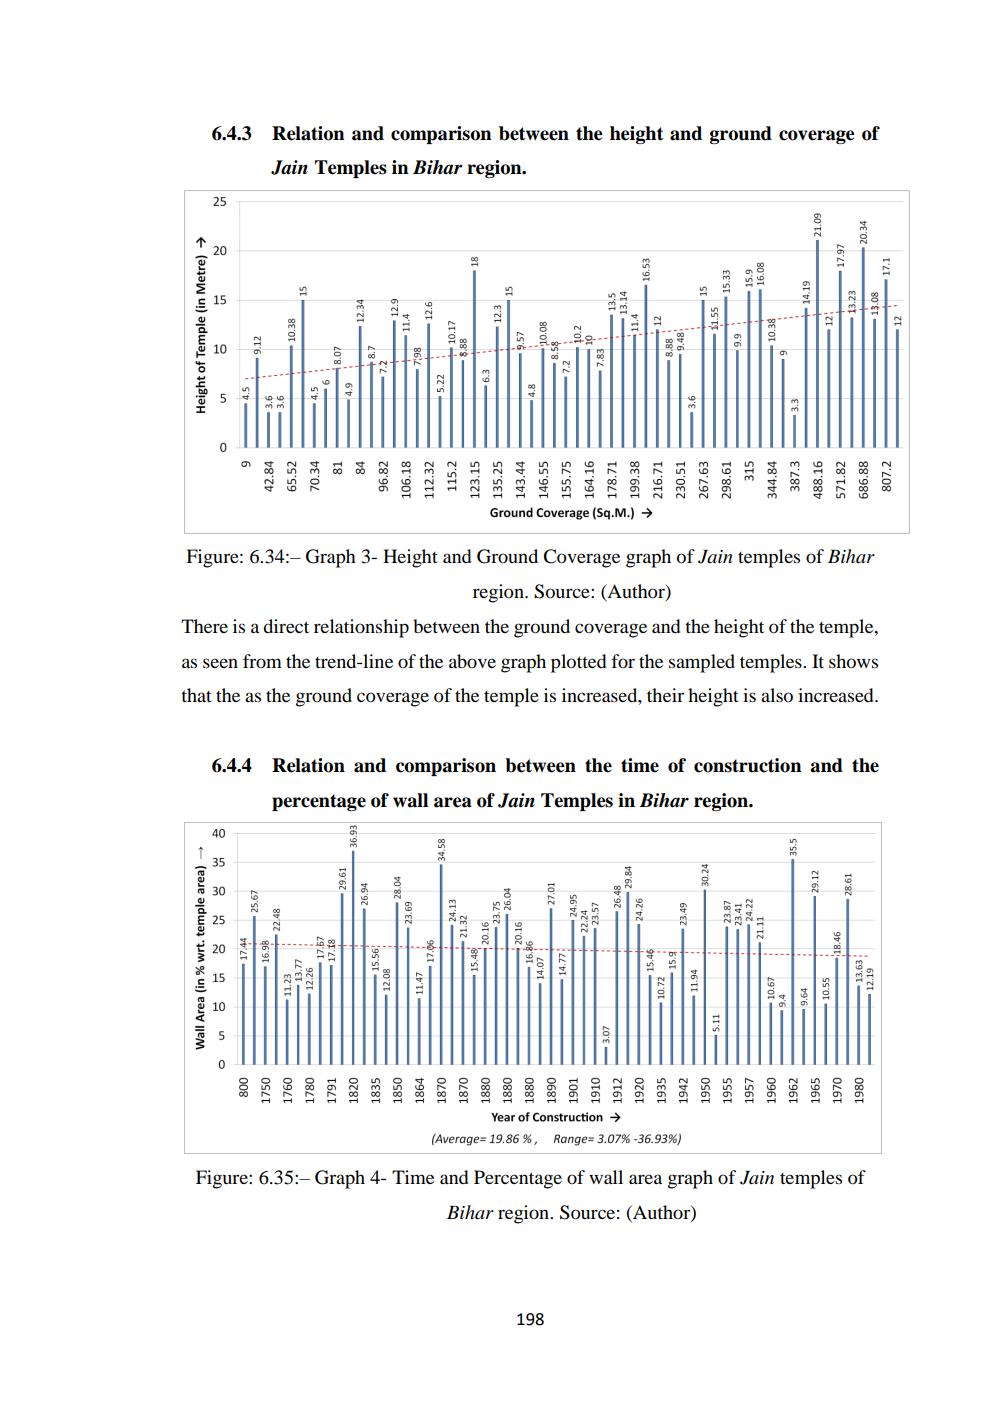
6.4.3 Relation and comparison between the height and ground coverage of
Jain Temples in Bihar region.
Wall Area (in % wrt. temple area)
25
20
15
O
0
40
35
30
25
20
15
10.38
10
12.34
17,44
-16.98
12.6
¿TOT
23.69
12.3
800
1750
1760 1780
1791
1820
1835
1850
1864
1870
13.14
0/8T
11.4
4.5
42.84 3.6
65.52
70.34
81
84
96.82
106.18
112.32
115.2
123.15
135.25
143.44
146.55
155.75
164.16
178.71
199.38
216.71
230.51
267.63
298.61
Ground Coverage (Sq.M.)
Eco
Figure: 6.34:- Graph 3- Height and Ground Coverage graph of Jain temples of Bihar
region. Source: (Author)
There is a direct relationship between the ground coverage and the height of the temple, as seen from the trend-line of the above graph plotted for the sampled temples. It shows that the as the ground coverage of the temple is increased, their height is also increased.
8.88
1806
6.4.4 Relation and comparison between the time of construction and the percentage of wall area of Jain Temples in Bihar region.
198
+15.33
1.55
Year of Construction →
(Average=19.86 %, Range=3.07% -36.93%)
1912
1920
1935
1942
1950
16.08
10.38
SS6T
14.19
1.09
0961
15b17.97
13.23
315
344.84
387.3
488.16
571.82
686.88
1962
40.34
80 ET
1965
1970
1980
Figure: 6.35:- Graph 4- Time and Percentage of wall area graph of Jain temples of
Bihar region. Source: (Author)
TZI
7:108