________________
Pre
Post
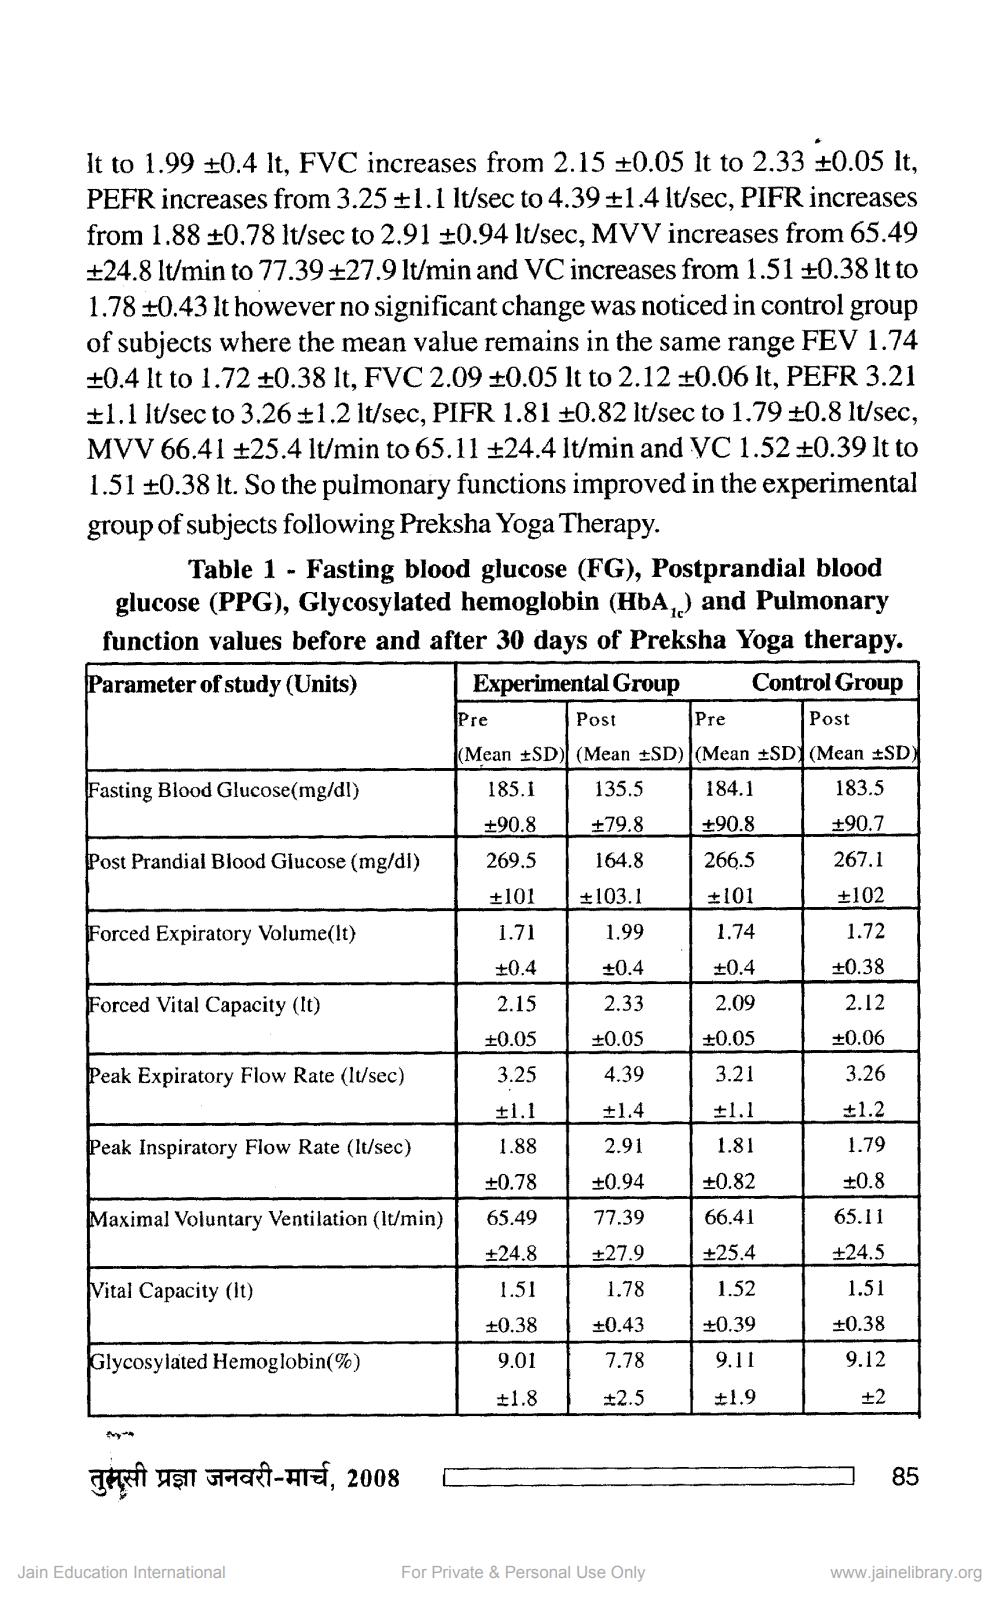
It to 1.99 +0.4 lt, FVC increases from 2.15 +0.05 lt to 2.33 +0.05 lt, PEFR increases from 3.25 +1.1 lt/sec to 4.391.4 lt/sec, PIFR increases from 1.88 +0.78 lt/sec to 2.91 +0.94 lt/sec, MVV increases from 65.49 +24.8 lt/min to 77.39 +27.9 lt/min and VC increases from 1.51 +0.38 lt to 1.78 +0.43 It however no significant change was noticed in control group of subjects where the mean value remains in the same range FEV 1.74 +0.4 lt to 1.72 +0.38 lt, FVC 2.09 +0.05 lt to 2.12 0.06 It, PEFR 3.21 +1.1 lt/sec to 3.26 +1.2 lt/sec, PIFR 1.81 +0.82 lt/sec to 1.79 +0.8 lt/sec, MVV 66.41 +25.4 lt/min to 65.11 +24.4 lt/min and VC 1.52 +0.39 lt to 1.51 +0.38 lt. So the pulmonary functions improved in the experimental group of subjects following Preksha Yoga Therapy.
Table 1 - Fasting blood glucose (FG), Postprandial blood glucose (PPG), Glycosylated hemoglobin (HbA,) and Pulmonary function values before and after 30 days of Preksha Yoga therapy. Parameter of study (Units)
Experimental Group Control Group
Pre
Post
(Mean SD) (Mean USD)(Mean USD (Mean USD) Fasting Blood Glucose(mg/dl)
185.1 135.5 184.1 183.5 +90.8 +79.8 +90.8
+90.7 Post Prandial Blood Glucose (mg/dl) 269.5 164.8
266.5
267.1 +101 #103.1
+101
+102 Forced Expiratory Volume(lt)
1.71 1.99 1.74
1.72 +0.4 +0.4 +0.4
+0.38 Forced Vital Capacity (lt)
2.15 2.33 2.09
2.12 10.05 +0.05 +0.05
+0.06 Peak Expiratory Flow Rate (lt/sec)
3.25 4.39 3.21
3.26 +1.1 +1.4 +1.1
+1.2 Peak Inspiratory Flow Rate (lt/sec) 1.88 2.91
1.81
1.79 +0.78 +0.94 +0.82
+0.8 Maximal Voluntary Ventilation (lt/min) 65.49 77.39 66.41 65.11
+24.8 +27.9 +25.4 +24.5 Vital Capacity (lt)
1.51 1.78 1.52
1.51 +0.38 +0.43
+0.39
+0.38 Glycosylated Hemoglobin(%)
9.01 7.78 9.11 9.12 +1.8 +2.5 +1.9
+2
Treni uşi
ARI-HTET, 2008
-
-
85
Jain Education International
For Private & Personal Use Only
www.jainelibrary.org