________________
(a) Forced Expiratory Volume (FEV),(b) Forced Vital Capacity (FVC), (c)Peak Expiratory Flow Rate (PEFR), (d) Peak Inspiratory Flow Rate (PIFR), (e)Maximal Voluntary Ventilation (MVV)and (f)Vital Capacity (VC). Statistical analysis
In this study only inter-group comparison was made with the aim to evaluate the net effect of Preksha Yoga Therapy vis-à-vis normal activity, at various follow-up stages. One tailed 't' test was applied and graded significance level was denoted as P<0.05 (*), P<0.01 (**), P <0.001 (***) which was taken from probability significant task. Results
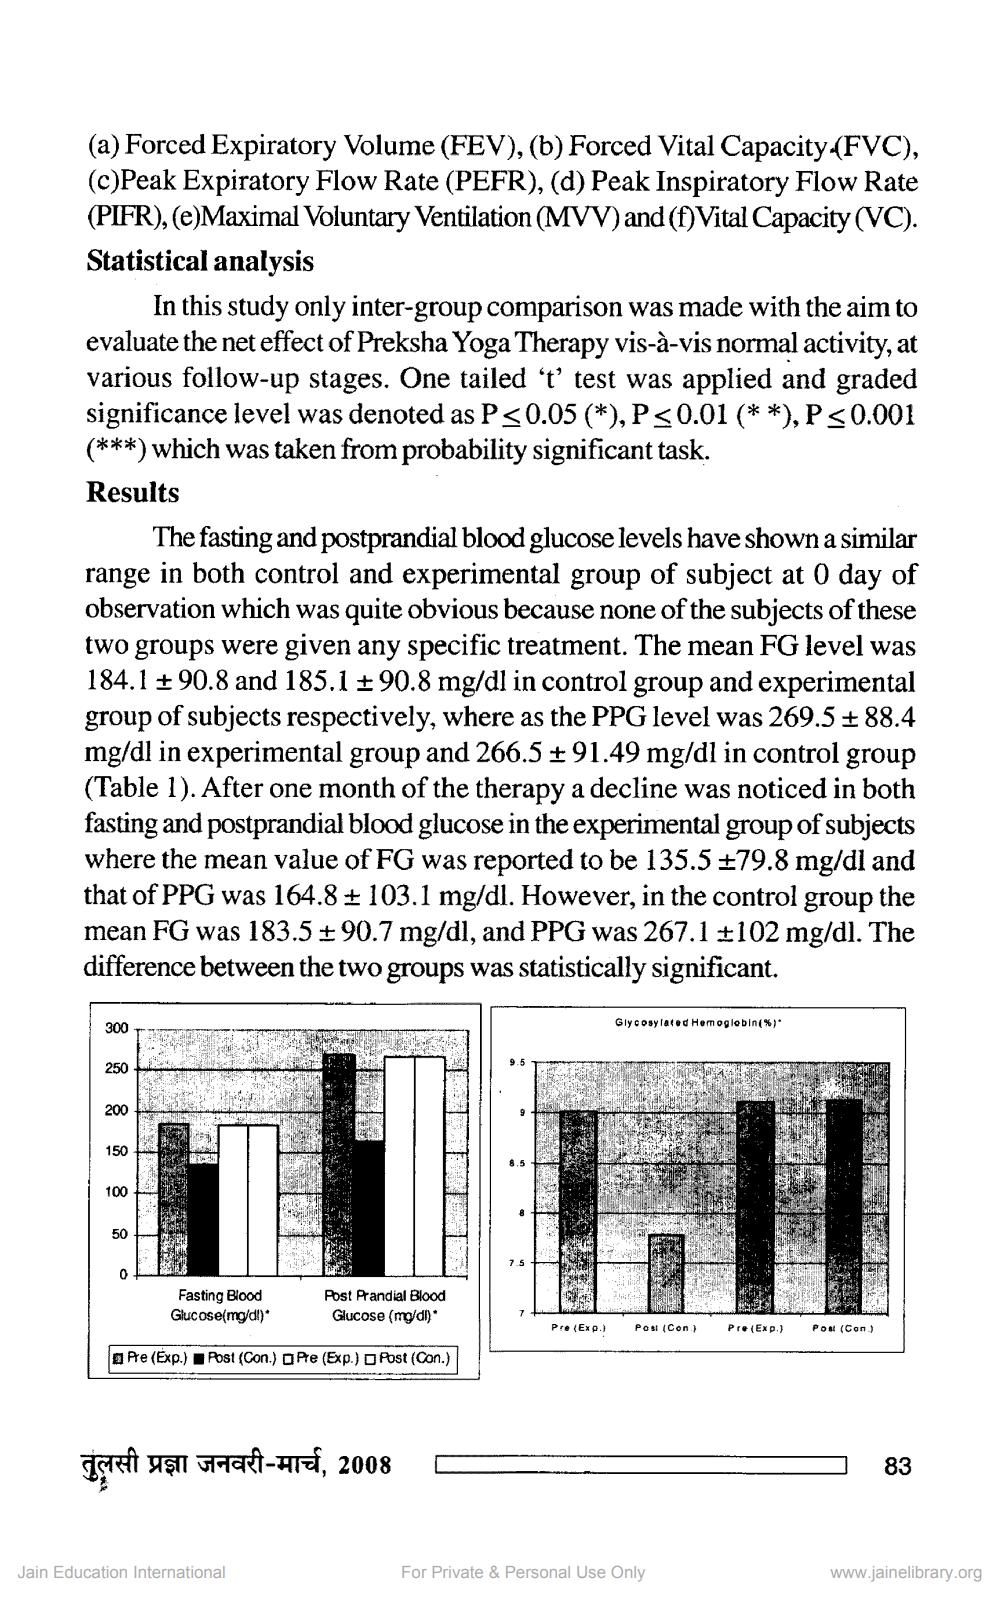
The fasting and postprandial blood glucose levels have shown a similar range in both control and experimental group of subject at 0 day of observation which was quite obvious because none of the subjects of these two groups were given any specific treatment. The mean FG level was 184.1 + 90.8 and 185.1 + 90.8 mg/dl in control group and experimental group of subjects respectively, where as the PPG level was 269.5+88.4 mg/dl in experimental group and 266.5 +91.49 mg/dl in control group (Table 1). After one month of the therapy a decline was noticed in both fasting and postprandial blood glucose in the experimental group of subjects where the mean value of FG was reported to be 135.5 79.8 mg/dl and that of PPG was 164.84 103.1 mg/dl. However, in the control group the mean FG was 183.5 90.7 mg/dl, and PPG was 267.1 2102 mg/dl. The difference between the two groups was statistically significant.
Glycosylated Hemoglobin(%)*
Fasting Blood Glucose(mg/dl)*
Post Prandial Blood Glucose (mg/dl)
Pre (Exp.)
Posi (Con)
Pre (Exp.)
Pos (Con)
Pre (Exp.)
Post (Con.)
Pre (Exp.)
Post (Con.) |
Irelli uşu wari-HIE, 2008
-
-
83
Jain Education International
For Private & Personal Use Only
www.jainelibrary.org