________________
OCTOBER, 1986
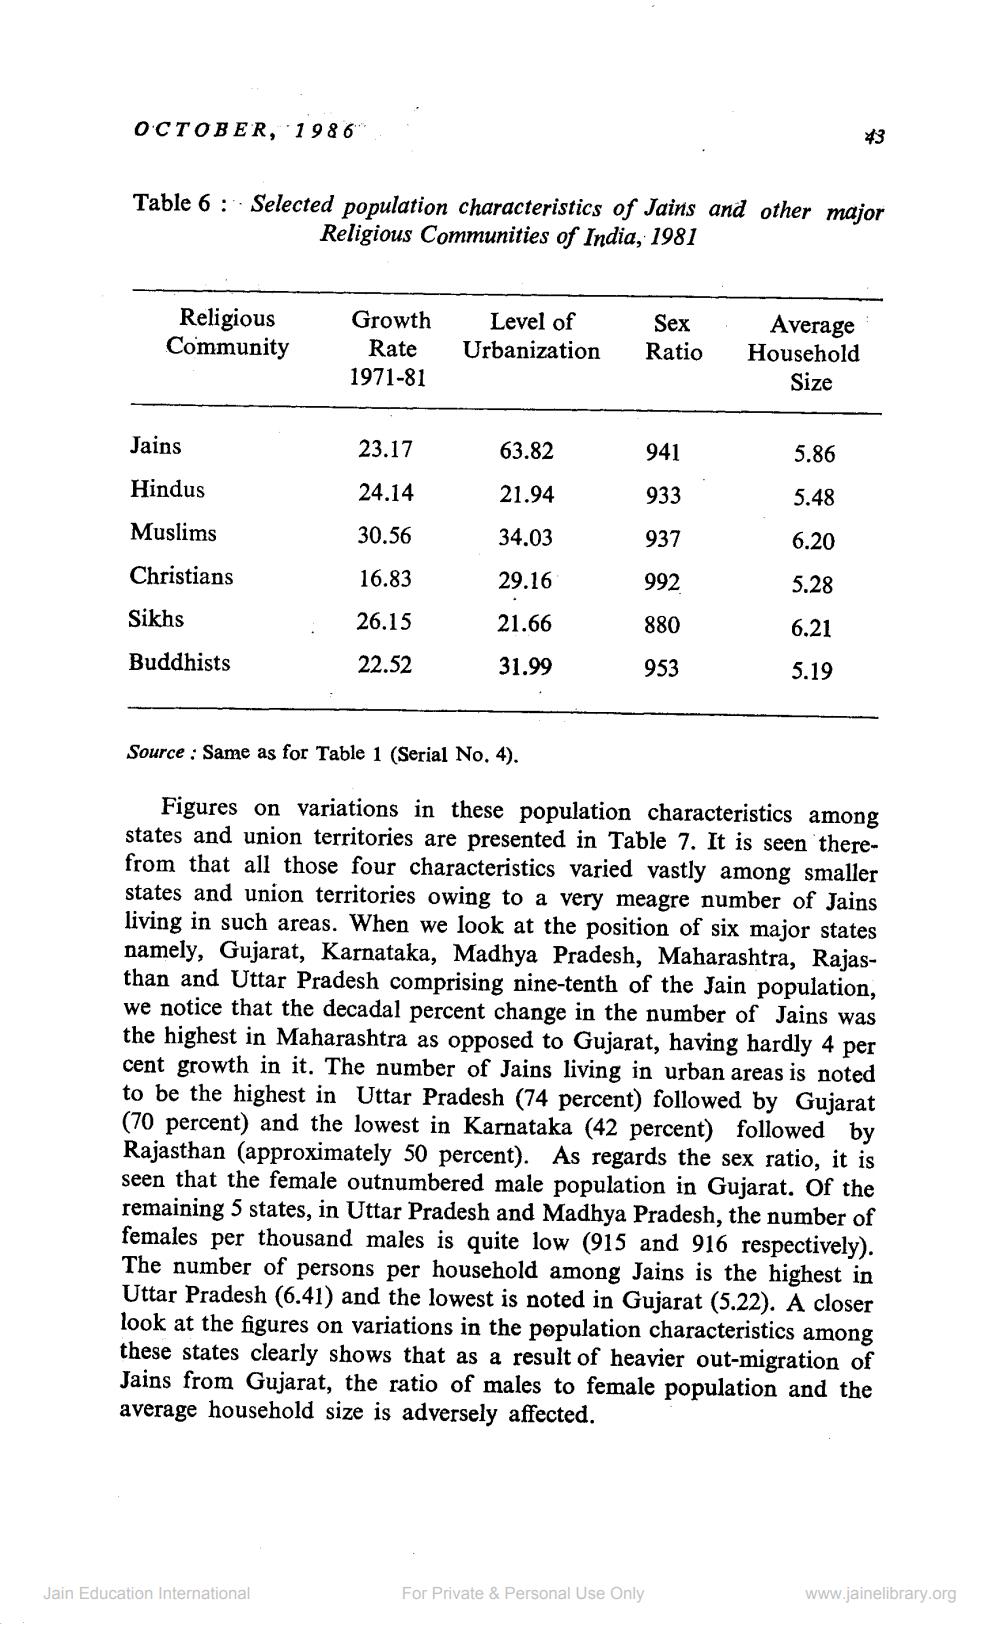
Table 6: Selected population characteristics of Jains and other major Religious Communities of India, 1981
Religious Community
Jains
Hindus
Muslims
Christians
Sikhs
Buddhists
Growth Rate
1971-81
Jain Education International
23.17
24.14
30.56
16.83
26.15
22.52
Level of
Urbanization
63.82
21.94
34.03
29.16
21.66
31.99
Sex Ratio
941
933
937
992
880
953
Average Household
Size
For Private & Personal Use Only
43
5.86
5.48
6.20
5.28
6.21
5.19
Source: Same as for Table 1 (Serial No. 4).
Figures on variations in these population characteristics among states and union territories are presented in Table 7. It is seen therefrom that all those four characteristics varied vastly among smaller states and union territories owing to a very meagre number of Jains living in such areas. When we look at the position of six major states namely, Gujarat, Karnataka, Madhya Pradesh, Maharashtra, Rajasthan and Uttar Pradesh comprising nine-tenth of the Jain population, we notice that the decadal percent change in the number of Jains was the highest in Maharashtra as opposed to Gujarat, having hardly 4 per cent growth in it. The number of Jains living in urban areas is noted to be the highest in Uttar Pradesh (74 percent) followed by Gujarat (70 percent) and the lowest in Karnataka (42 percent) followed by Rajasthan (approximately 50 percent). As regards the sex ratio, it is seen that the female outnumbered male population in Gujarat. Of the remaining 5 states, in Uttar Pradesh and Madhya Pradesh, the number of females per thousand males is quite low (915 and 916 respectively). The number of persons per household among Jains is the highest in Uttar Pradesh (6.41) and the lowest is noted in Gujarat (5.22). A closer look at the figures on variations in the population characteristics among these states clearly shows that as a result of heavier out-migration of Jains from Gujarat, the ratio of males to female population and the average household size is adversely affected.
www.jainelibrary.org