________________
JAIN JOURNAL
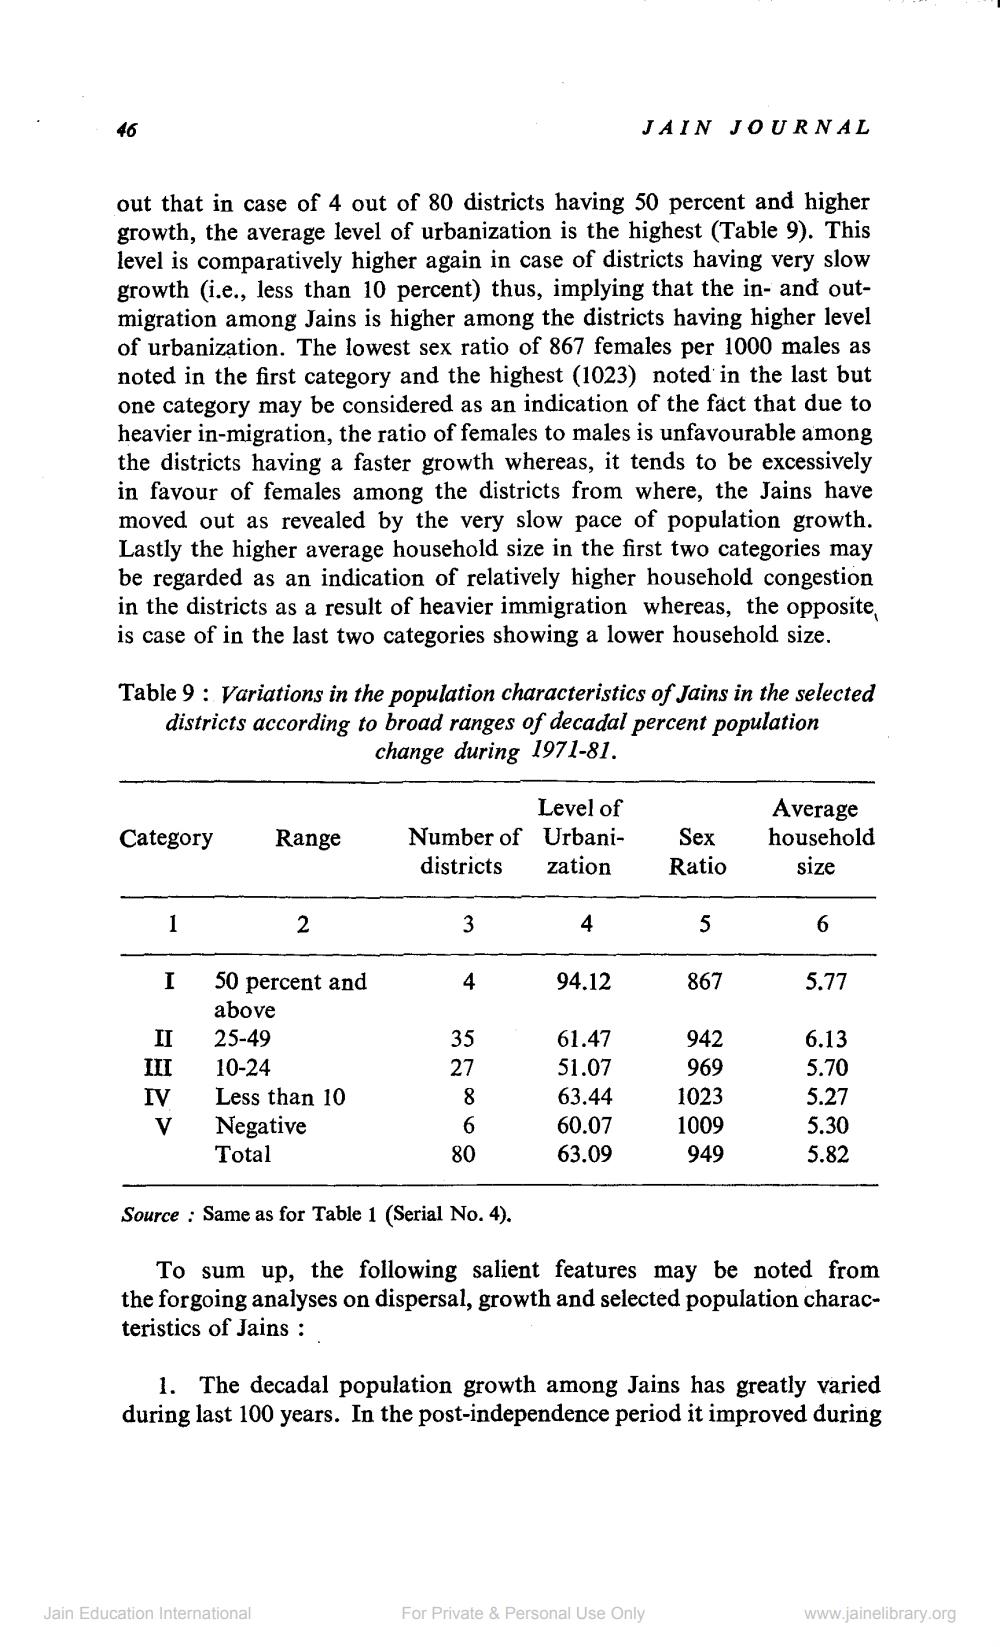
out that in case of 4 out of 80 districts having 50 percent and higher growth, the average level of urbanization is the highest (Table 9). This level is comparatively higher again in case of districts having very slow growth i.e., less than 10 percent) thus, implying that the in- and outmigration among Jains is higher among the districts having higher level of urbanization. The lowest sex ratio of 867 females per 1000 males as noted in the first category and the highest (1023) noted in the last but one category may be considered as an indication of the fact that due to heavier in-migration, the ratio of females to males is unfavourable among the districts having a faster growth whereas, it tends to be excessively in favour of females among the districts from where, the Jains have moved out as revealed by the very slow pace of population growth. Lastly the higher average household size in the first two categories may be regarded as an indication of relatively higher household congestion in the districts as a result of heavier immigration whereas, the opposite is case of in the last two categories showing a lower household size.
Table 9 : Variations in the population characteristics of Jains in the selected districts according to broad ranges of decadal percent population
change during 1971-81.
Category
Range
Level of Number of Urbanidistrictszation
Sex Ratio
Average household
size
1
2
4
5
6
94.12
867
5.77
III IV
50 percent and above 25-49 10-24 Less than 10 Negative Total
61.47 51.07 63.44 60.07 63.09
942 969 1023 1009
6.13 5.70 5.27 5.30 5.82
80
949
Source : Same as for Table 1 (Serial No. 4).
To sum up, the following salient features may be noted from the forgoing analyses on dispersal, growth and selected population characteristics of Jains :
1. The decadal population growth among Jains has greatly varied during last 100 years. In the post-independence period it improved during
Jain Education International
For Private & Personal Use Only
www.jainelibrary.org


