________________
OCTOBER, 1986
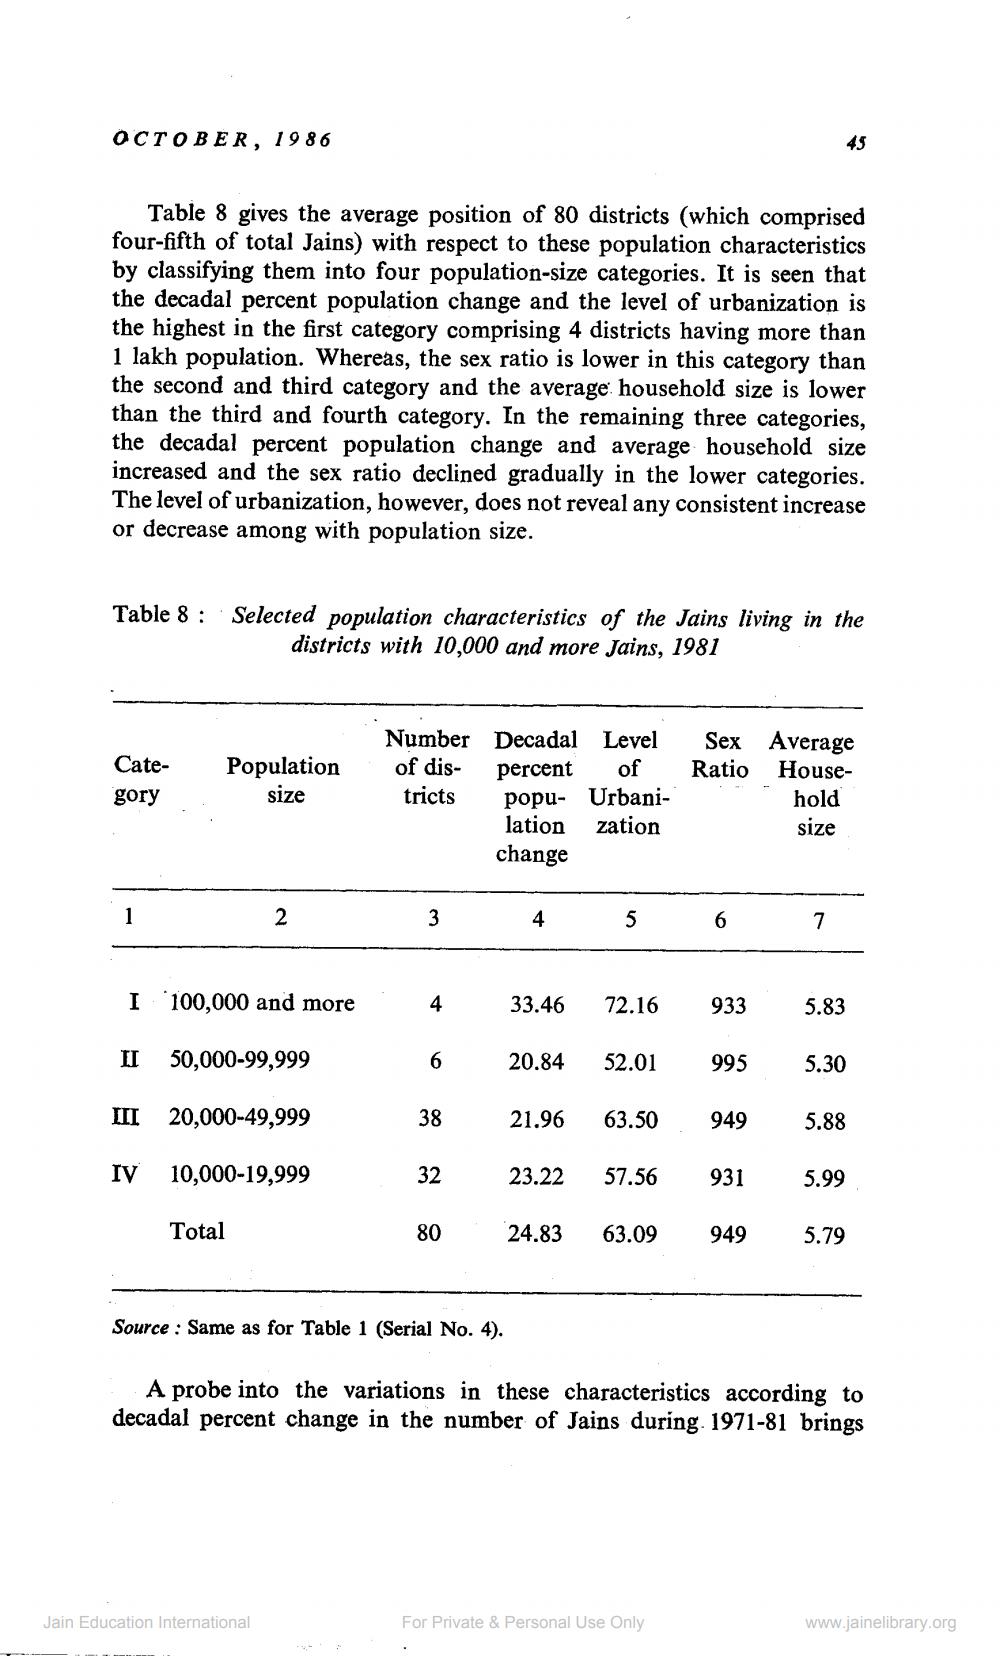
Table 8 gives the average position of 80 districts (which comprised four-fifth of total Jains) with respect to these population characteristics by classifying them into four population-size categories. It is seen that the decadal percent population change and the level of urbanization is the highest in the first category comprising 4 districts having more than 1 lakh population. Whereas, the sex ratio is lower in this category than the second and third category and the average household size is lower than the third and fourth category. In the remaining three categories, the decadal percent population change and average household size increased and the sex ratio declined gradually in the lower categories. The level of urbanization, however, does not reveal any consistent increase or decrease among with population size.
Table 8 :
Selected population characteristics of the Jains living in the
districts with 10,000 and more Jains, 1981
Cate- gory
Population
size
Number Decadal Level of dis- percent of tricts
popu- Urbanilation zation change
Sex Average Ratio House
hold size
1
2
3
4
5
6
7
I *100,000 and more
4
33.46
72.16
933
5.83
II
50,000-99,999
20.84
52.01
995
5.30
III
20,000-49,999
IV
10,000-19,999
21.96 63.50 949 5.88 23.22 57.56
5.99 24.83 63.099495.79
931
Total
80
Source : Same as for Table 1 (Serial No. 4).
A probe into the variations in these characteristics according to decadal percent change in the number of Jains during 1971-81 brings
Jain Education International
For Private & Personal Use Only
www.jainelibrary.org