________________
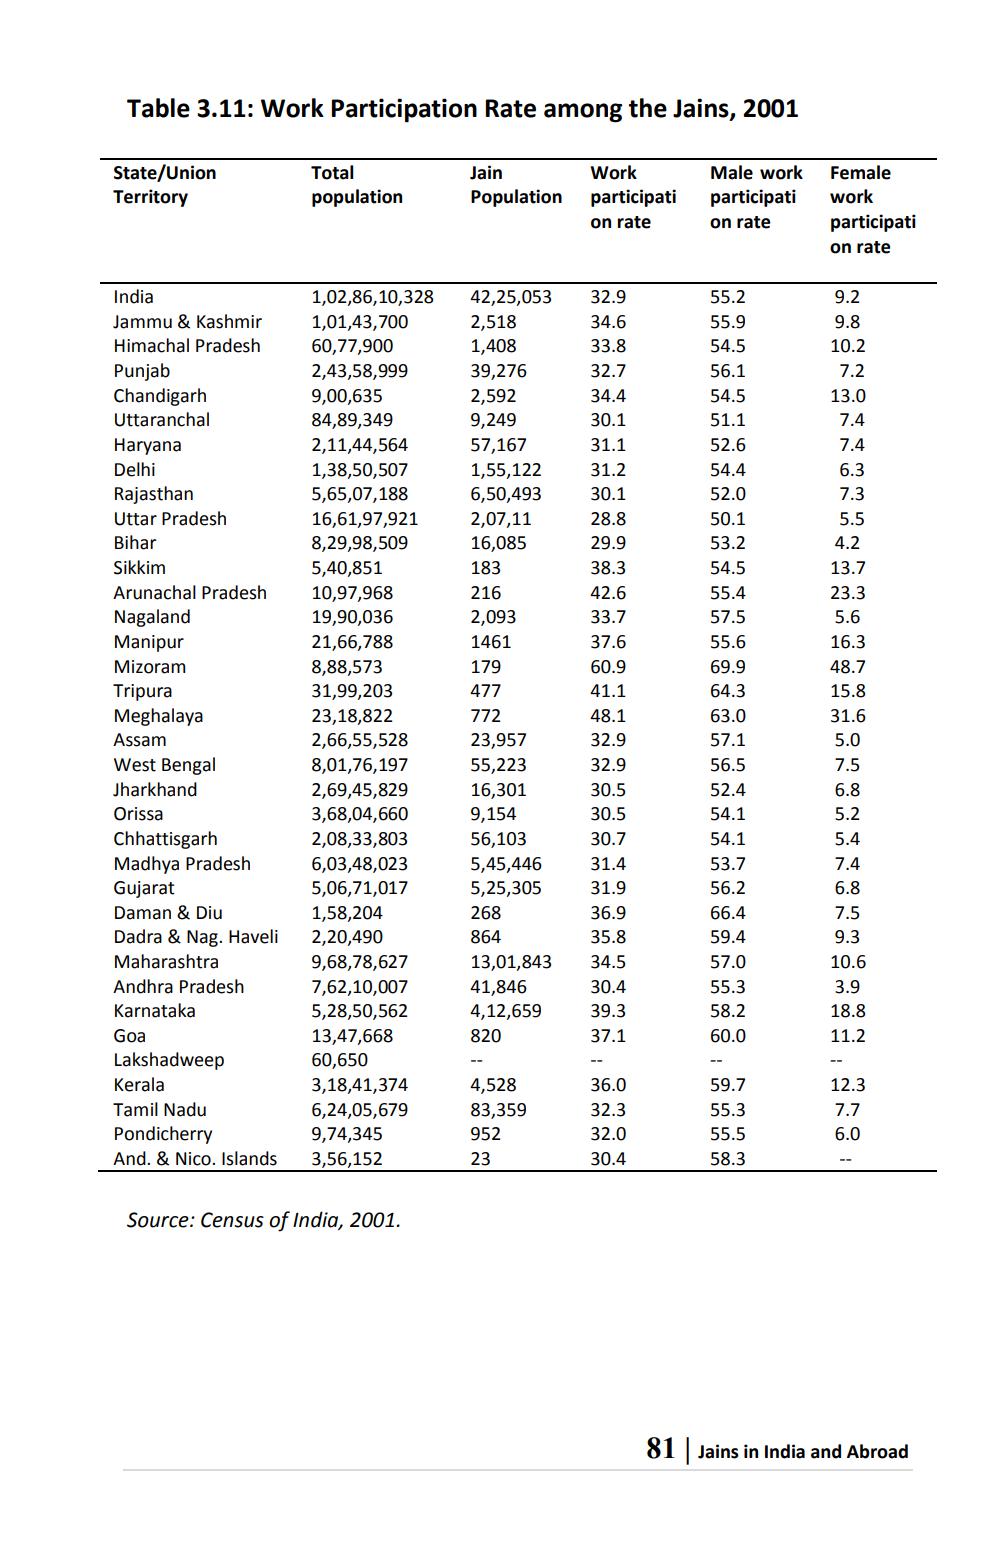
Table 3.11: Work Participation Rate among the Jains, 2001
State/Union Territory
Total population
Jain Population
Work participati on rate
Male work Female participatiwork on rate participati
on rate
9.2
9.8
10.2
32.9 34.6 33.8 32.7 34.4 30.1 31.1 31.2 30.1 28.8 29.9 38.3 42.6 33.7
India Jammu & Kashmir Himachal Pradesh Punjab Chandigarh Uttaranchal Haryana Delhi Rajasthan Uttar Pradesh Bihar Sikkim Arunachal Pradesh Nagaland Manipur Mizoram Tripura Meghalaya Assam West Bengal Jharkhand Orissa Chhattisgarh Madhya Pradesh Gujarat Daman & Diu Dadra & Nag. Haveli Maharashtra Andhra Pradesh Karnataka Goa Lakshadweep Kerala Tamil Nadu Pondicherry And. & Nico. Islands
37.6
1,02,86,10,328 1,01,43,700 60,77,900 2,43,58,999 9,00,635 84,89,349 2,11,44,564 1,38,50,507 5,65,07,188 16,61,97,921 8,29,98,509 5,40,851 10,97,968 19,90,036 21,66,788 8,88,573 31,99,203 23,18,822 2,66,55,528 8,01,76,197 2,69,45,829 3,68,04,660 2,08,33,803 6,03,48,023 5,06,71,017 1,58,204 2,20,490 9,68,78,627 7,62,10,007 5,28,50,562 13,47,668 60,650 3,18,41,374 6,24,05,679 9,74,345 3,56,152
42,25,053 2,518 1,408 39,276 2,592 9,249 57,167 1,55,122 6,50,493 2,07,11 16,085 183 216 2,093 1461 179 477 772 23,957 55,223 16,301 9,154 56,103 5,45,446 5,25,305 268 864 13,01,843 41,846 4,12,659 820
7.2 13.0 7.4 7.4 6.3 7.3 5.5 4.2 13.7 23.3
5.6 16.3 48.7 15.8 31.6 5.0
55.2 55.9 54.5 56.1 54.5 51.1 52.6 54.4 52.0 50.1 53.2 54.5 55.4 57.5 55.6 69.9 64.3 63.0 57.1 56.5 52.4 54.1 54.1 53.7 56.2 66.4 59.4 57.0 55.3 58.2 60.0
60.9 41.1 48.1 32.9 32.9 30.5 30.5 30.7 31.4 31.9 36.9 35.8 34.5 30.4 39.3 37.1
7.5
7.5
9.3
10.6 3.9 18.8 11.2
4,528 83,359
36.0 32.3 32.0 30.4
59.7 55.3 55.5 58.3
12.3 7.7 6.0
952 23
Source: Census of India, 2001.
81 Jains in India and Abroad


