________________
Population
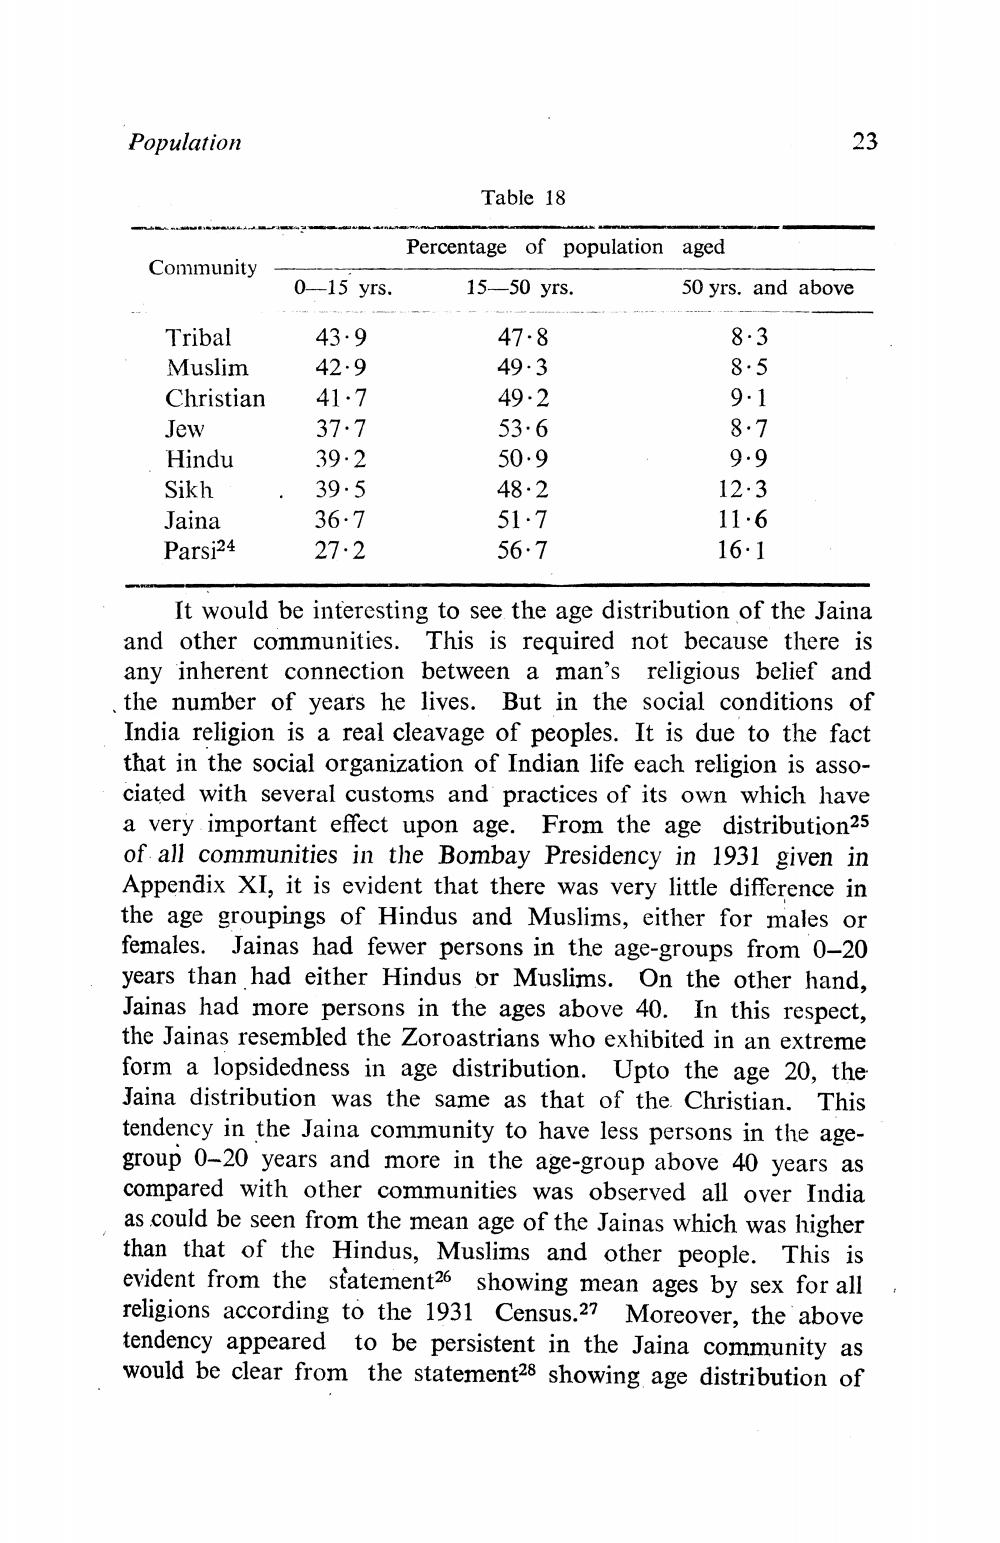
Table 18
Community
Percentage of population aged 15—50 yrs.
50 yrs. and above
0--15 yrs.
43.9
42.9
Tribal Muslim Christian Jew Hindu Sikh Jaina Parsi24
41.7 37.7 39.2 39.5 36.7 27.2
47.8 49.3 49.2 53.6 50.9 48.2 51.7 56.7
8.3 8.5 9.1 8.7
9.9 12.3 11.6 16.1
It would be interesting to see the age distribution of the Jaina and other communities. This is required not because there is any inherent connection between a man's religious belief and the number of years he lives. But in the social conditions of India religion is a real cleavage of peoples. It is due to the fact that in the social organization of Indian life each religion is associated with several customs and practices of its own which have a very important effect upon age. From the age distribution25 of all communities in the Bombay Presidency in 1931 given in Appendix XI, it is evident that there was very little difference in the age groupings of Hindus and Muslims, either for males or females. Jainas had fewer persons in the age-groups from 0-20 years than had either Hindus or Muslims. On the other hand, Jainas had more persons in the ages above 40. In this respect, the Jainas resembled the Zoroastrians who exhibited in an extreme form a lopsidedness in age distribution. Upto the age 20, the Jaina distribution was the same as that of the Christian. This tendency in the Jaina community to have less persons in the agegroup 0-20 years and more in the age-group above 40 years as compared with other communities was observed all over India as could be seen from the mean age of the Jainas which was higher than that of the Hindus, Muslims and other people. This is evident from the statement26 showing mean ages by sex for all religions according to the 1931 Census.27 Moreover, the above tendency appeared to be persistent in the Jaina community as would be clear from the statement28 showing age distribution of


