________________
Jaina Community--A Social Survey
to males varies inversely according to social status is true also in the case of several castes of the Jaina community. The population figures of several castes in the Jaina community are not readily available and special efforts will have to be made to ascertain the sex composition of various castes in the Jaina community.
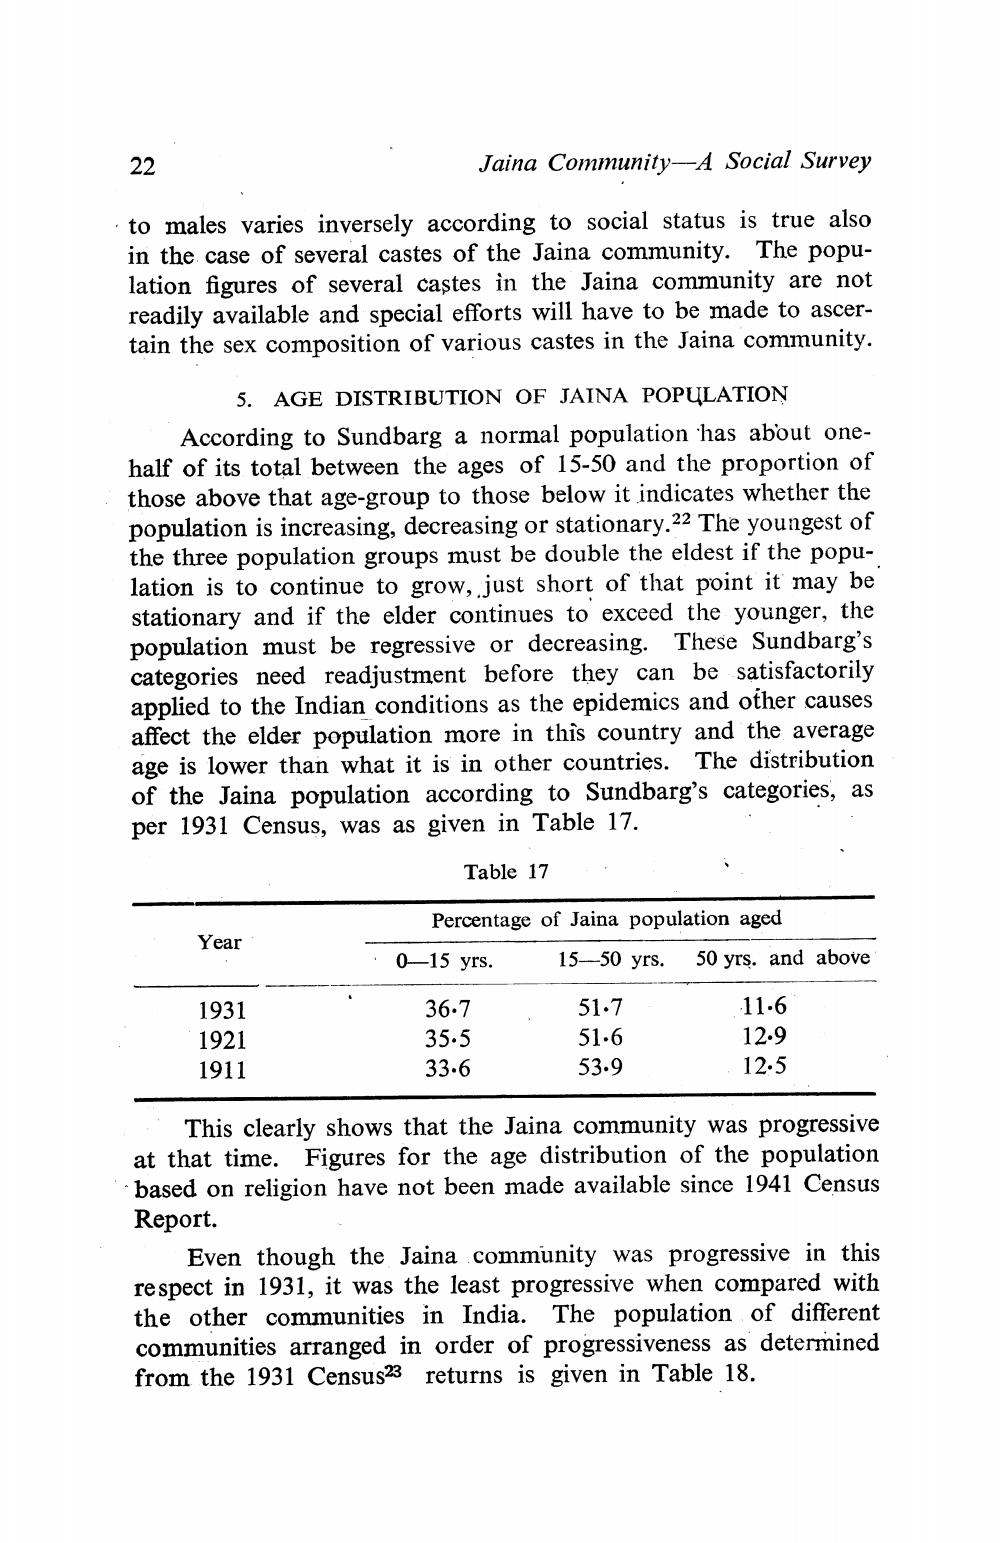
5. AGE DISTRIBUTION OF JAINA POPULATION According to Sundbarg a normal population has about onehalf of its total between the ages of 15-50 and the proportion of those above that age-group to those below it indicates whether the population is increasing, decreasing or stationary.22 The youngest of the three population groups must be double the eldest if the population is to continue to grow, just short of that point it may be stationary and if the elder continues to exceed the younger, the population must be regressive or decreasing. These Sundbarg's categories need readjustment before they can be satisfactorily applied to the Indian conditions as the epidemics and other causes affect the elder population more in this country and the average age is lower than what it is in other countries. The distribution of the Jaina population according to Sundbarg's categories, as per 1931 Census, was as given in Table 17.
Table 17
Percentage of Jaina population aged
Year
.0—15 yrs.
15—50 yrs.
50 yrs. and above
1931 1921 1911
36.7 35.5 33.6
51.7 51.6 53.9
11.6 12.9 12:5
This clearly shows that the Jaina community was progressive at that time. Figures for the age distribution of the population based on religion have not been made available since 1941 Census Report.
Even though the Jaina community was progressive in this respect in 1931, it was the least progressive when compared with the other communities in India. The population of different communities arranged in order of progressiveness as determined from the 1931 Census23 returns is given in Table 18.


