________________
10
Jaina Community-A Social Survey
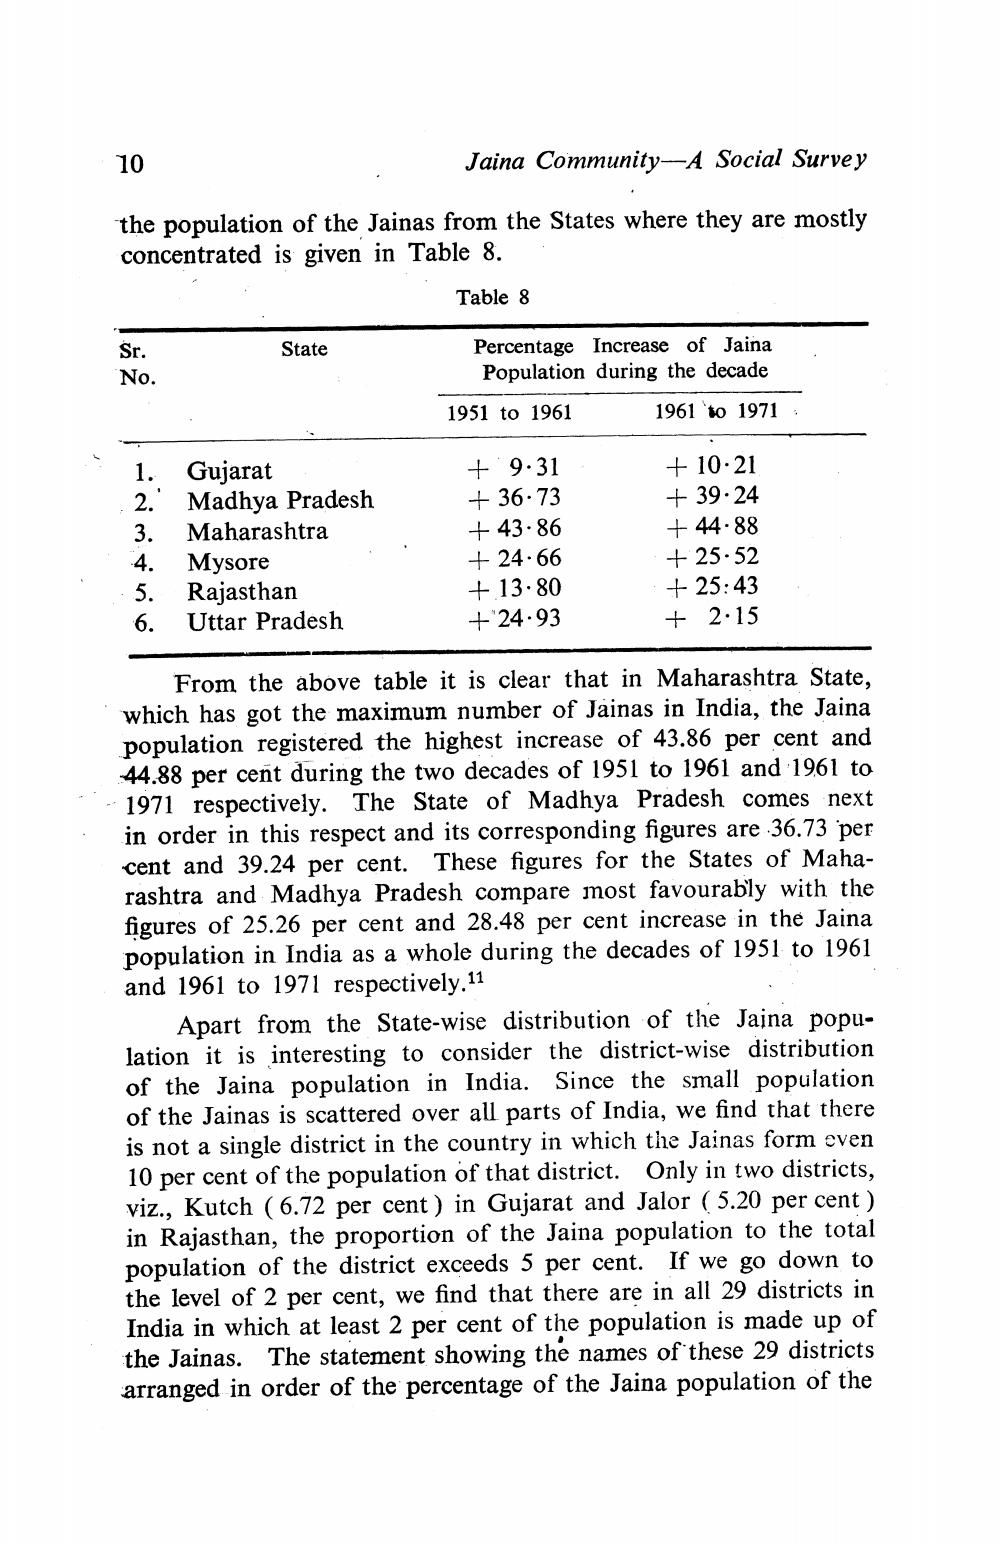
the population of the Jainas from the States where they are mostly concentrated is given in Table 8.
Table 8
Sr.
State
No.
Percentage Increase of Jaina
Population during the decade 1951 to 1961 1961 to 1971
+
+
1. Gujarat . Madhya Pradesh 3. Maharashtra 4. Mysore 5. Rajasthan 6. Uttar Pradesh
+ 9.31 + 36.73 + 43.86 + 24.66 + 13.80 + 24.93
+ 10.21 + 39.24 + 44.88 + 25.52 + 25:43 + 2.15
From the above table it is clear that in Maharashtra State, which has got the maximum number of Jainas in India, the Jaina population registered the highest increase of 43.86 per cent and 44.88 per cent during the two decades of 1951 to 1961 and 1961 to 1971 respectively. The State of Madhya Pradesh comes next in order in this respect and its corresponding figures are 36.73 per cent and 39.24 per cent. These figures for the States of Maharashtra and Madhya Pradesh compare most favourably with the figures of 25.26 per cent and 28.48 per cent increase in the Jaina population in India as a whole during the decades of 1951 to 1961 and 1961 to 1971 respectively. 11
Apart from the State-wise distribution of the Jaina population it is interesting to consider the district-wise distribution of the Jaina population in India. Since the small population of the Jainas is scattered over all parts of India, we find that there is not a single district in the country in which the Jainas form even 10 per cent of the population of that district. Only in two districts, viz., Kutch (6.72 per cent ) in Gujarat and Jalor (5.20 per cent ) in Rajasthan, the proportion of the Jaina population to the total population of the district exceeds 5 per cent. If we go down to the level of 2 per cent, we find that there are in all 29 districts in India in which at least 2 per cent of the population is made up of the Jainas. The statement showing the names of these 29 districts arranged in order of the percentage of the Jaina population of the


