________________
Population
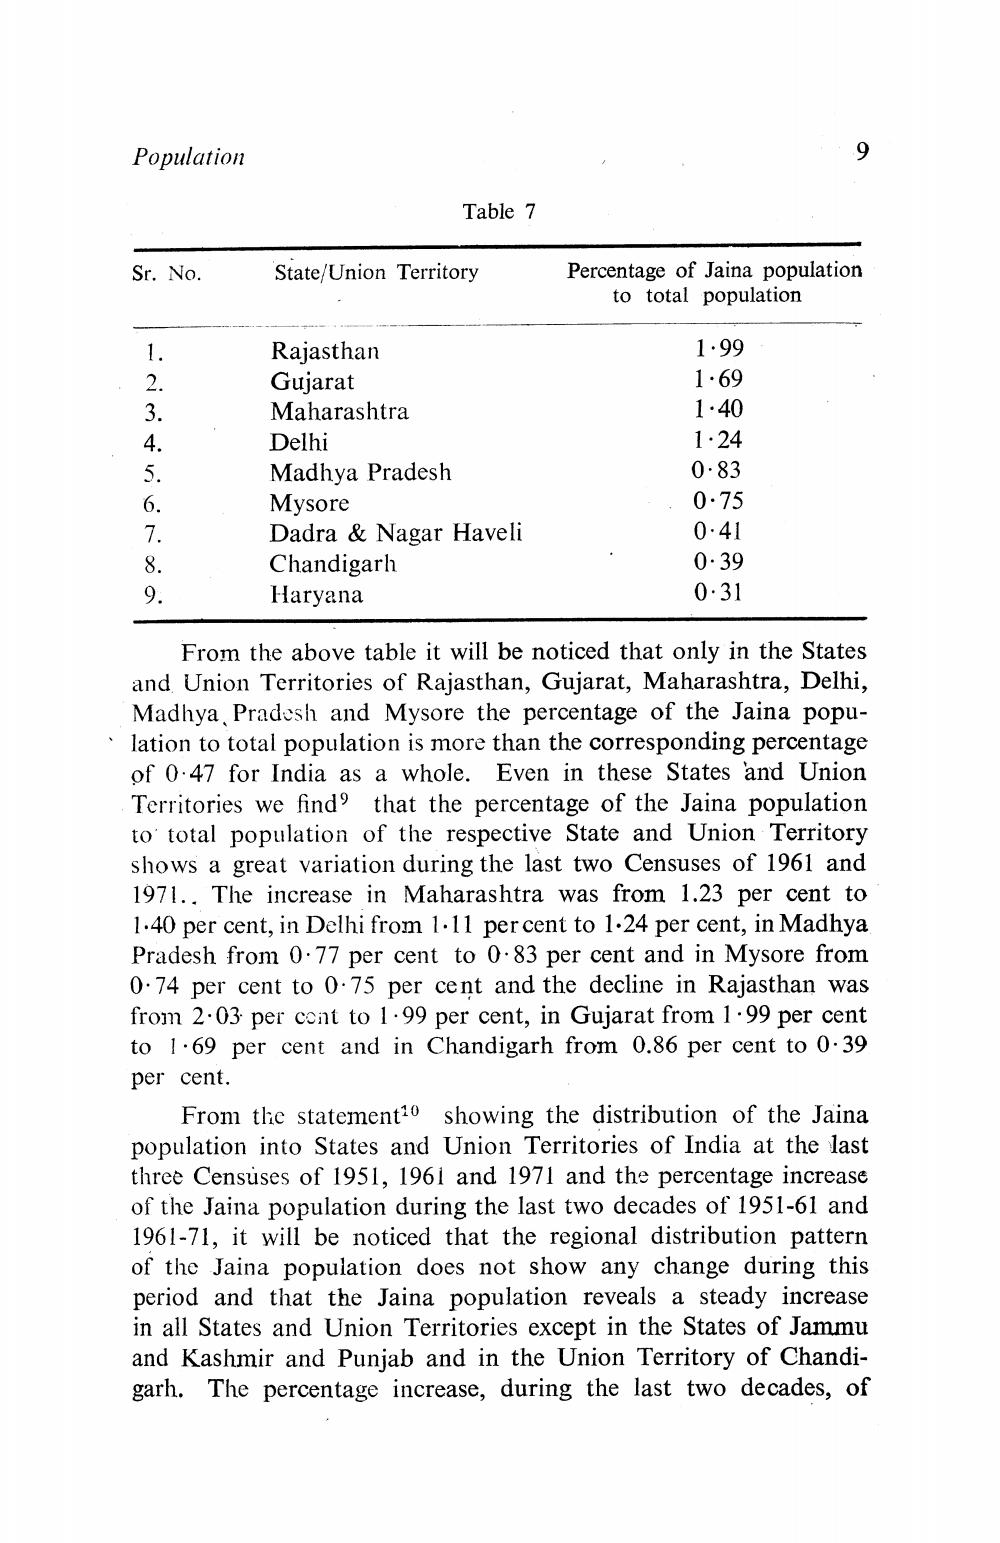
Table 7
Sr. No.
State/Union Territory
Percentage of Jaina population
to total population
citronsol
Rajasthan Gujarat Maharashtra Delhi Madhya Pradesh Mysore Dadra & Nagar Haveli Chandigarh Haryana
1.99 1.69 1.40 1.24 0.83 0.75 0.41 0.39 0.31
From the above table it will be noticed that only in the States and Union Territories of Rajasthan, Gujarat, Maharashtra, Delhi, Madhya Pradesh and Mysore the percentage of the Jaina population to total population is more than the corresponding percentage of 0.47 for India as a whole. Even in these States and Union Territories we find that the percentage of the Jaina population to' total population of the respective State and Union Territory shows a great variation during the last two Censuses of 1961 and 1971. The increase in Maharashtra was from 1.23 per cent to 1.40 per cent, in Delhi from 1.11 per cent to 1.24 per cent, in Madhya Pradesh from 0.77 per cent to 0.83 per cent and in 0.74 per cent to 0.75 per cent and the decline in Rajasthan was from 2:03 per cent to 1.99 per cent, in Gujarat from 1.99 per cent to 1.69 per cent and in Chandigarh from 0.86 per cent to 0.39 per cent.
From the statement20 showing the distribution of the Jaina population into States and Union Territories of India at the last three Censuses of 1951, 1961 and 1971 and the percentage increase of the Jaina population during the last two decades of 1951-61 an 1961-71, it will be noticed that the regional distribution pattern of the Jaina population does not show any change during this period and that the Jaina population reveals a steady increase in all States and Union Territories except in the States of Jammu and Kashmir and Punjab and in the Union Territory of Chandigarh. The percentage increase, during the last two decades, of


