________________
48
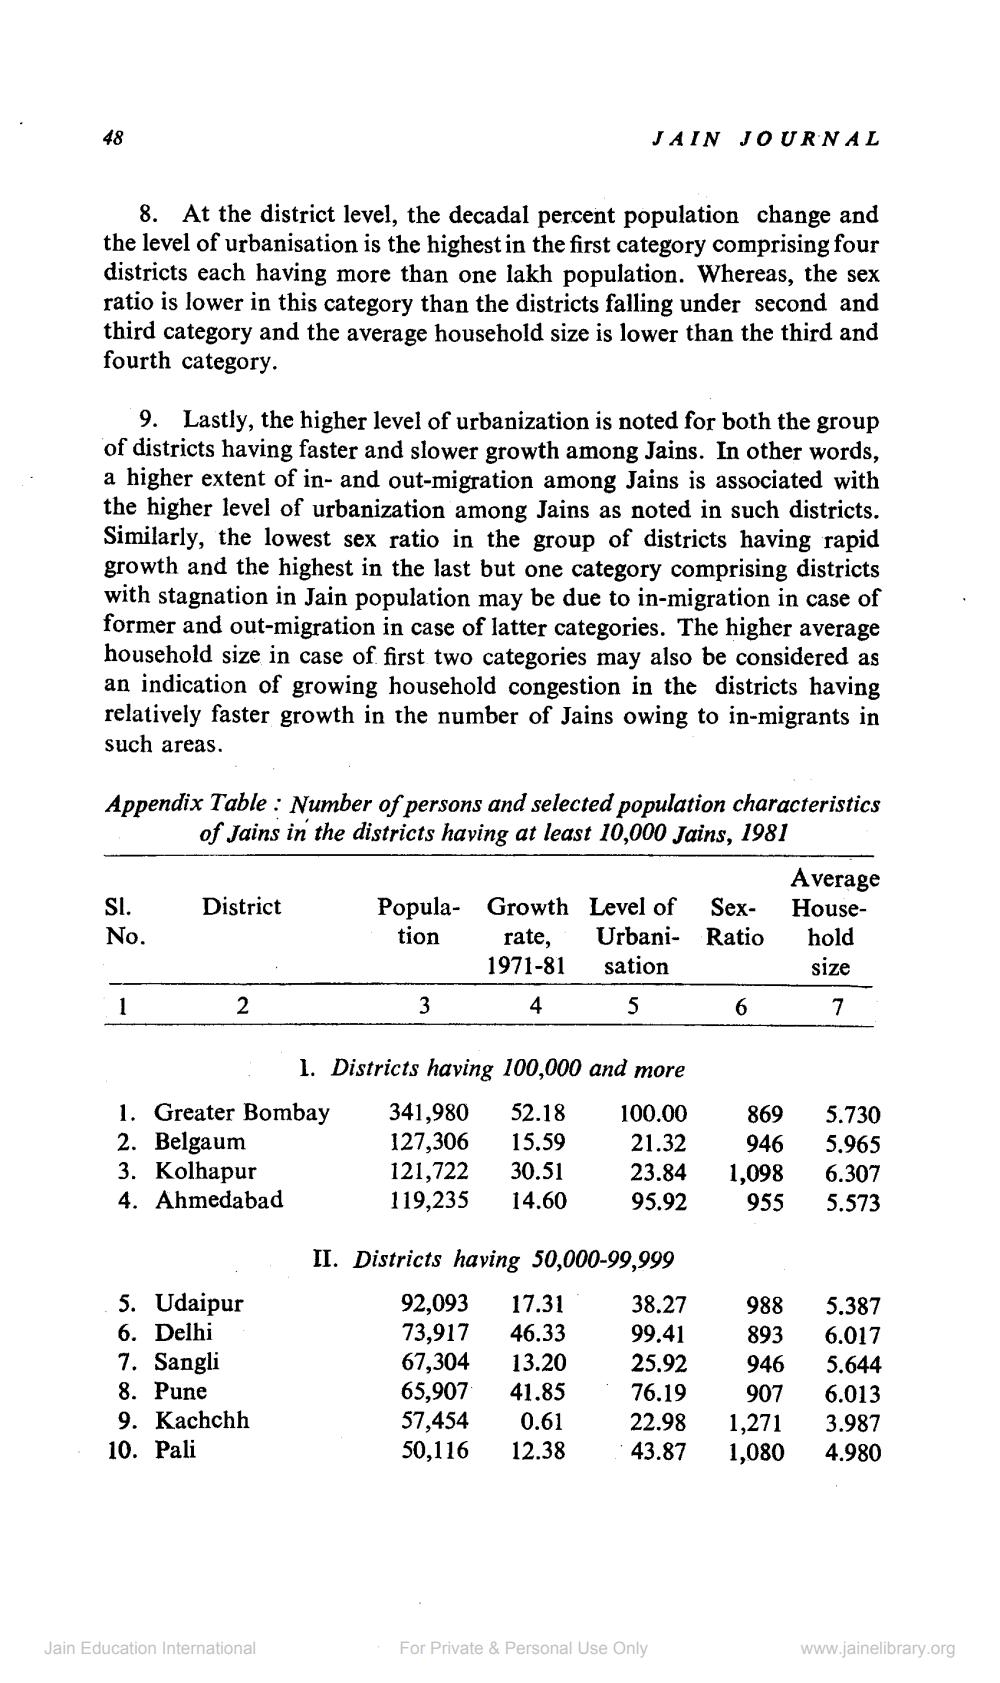
8. At the district level, the decadal percent population change and the level of urbanisation is the highest in the first category comprising four districts each having more than one lakh population. Whereas, the sex ratio is lower in this category than the districts falling under second and third category and the average household size is lower than the third and fourth category.
9. Lastly, the higher level of urbanization is noted for both the group of districts having faster and slower growth among Jains. In other words, a higher extent of in- and out-migration among Jains is associated with the higher level of urbanization among Jains as noted in such districts. Similarly, the lowest sex ratio in the group of districts having rapid growth and the highest in the last but one category comprising districts with stagnation in Jain population may be due to in-migration in case of former and out-migration in case of latter categories. The higher average household size in case of first two categories may also be considered as an indication of growing household congestion in the districts having relatively faster growth in the number of Jains owing to in-migrants in such areas.
Appendix Table: Number of persons and selected population characteristics of Jains in the districts having at least 10,000 Jains, 1981
SI. No.
1
District
2
1. Greater Bombay
2. Belgaum
3. Kolhapur
4. Ahmedabad
5. Udaipur
6. Delhi
7. Sangli
8. Pune
9. Kachchh
10. Pali
JAIN JOURNAL
Jain Education International
Popula- Growth Level of Sextion rate,
1971-81
4
3
Urbani
sation
5
1. Districts having 100,000 and more
100.00
869
341,980 52.18 127,306 15.59
21.32 946 23.84 1,098
121,722 30.51
119,235 14.60
95.92
955
II. Districts having 50,000-99,999
92,093
17.31
73,917
46.33
67,304 13.20
65,907 41.85
57,454 0.61 50,116 12.38
38.27
99.41
25.92
76.19
22.98
43.87
For Private & Personal Use Only
Ratio hold
size
7
6
Average House
988
893
946
907
1,271
1,080
5.730
5.965
6.307
5.573
5.387
6.017
5.644
6.013
3.987
4.980
www.jainelibrary.org


