________________
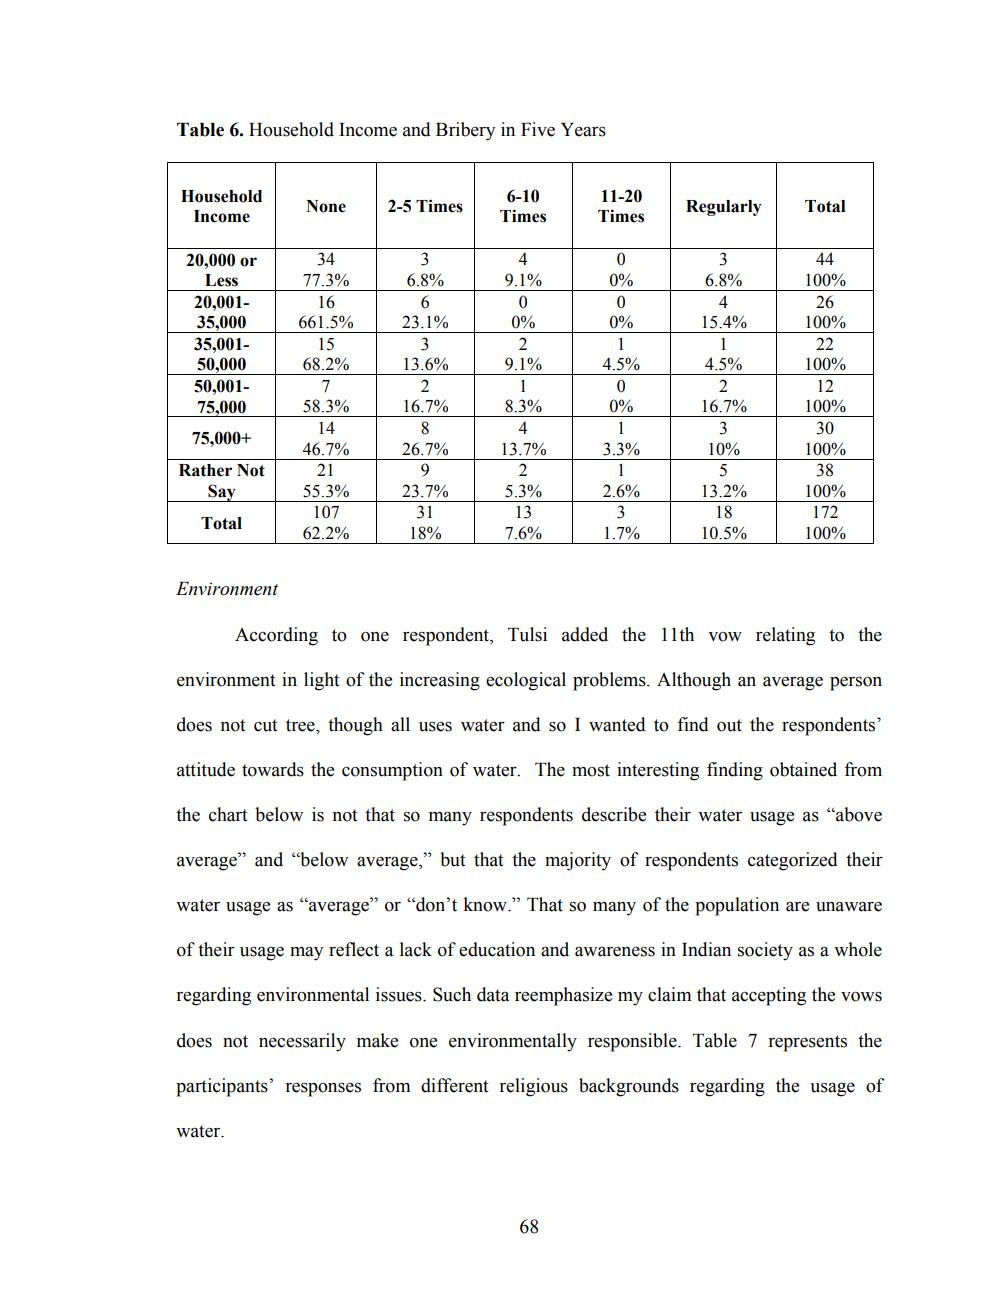
Table 6. Household Income and Bribery in Five Years
Household
Income
None
2-5 Times
6-10 Times
11-20 Times
Regularly
Total
6.8%
9.1%
44 100%
6.8%
34 77.3%
16 661.5%
26
23.1%
0%
15.4%
20,000 or
Less 20,00135,000 35,00150,000 50,00175,000
Is
68.2%
13.6%
4.5%
9.1%
1 8.3%
4.5%
0
58.3%
0%
16.7%
14
16.7%
8 26.7%
100%
22 100%
12 100%
30 100%
38 100%
172 100%
75,000+
13.7%
3.3%
10%
Rather Not
46.7%
21 55.3%
107 62.2%
2.6%
23.7%
31 18%
5.3%
13 7.6%
13.2%
18 10.5%
Total
1.7%
Environment
According to one respondent, Tulsi added the 11th vow relating to the
environment in light of the increasing ecological problems. Although an average person
does not cut tree, though all uses water and so I wanted to find out the respondents'
attitude towards the consumption of water. The most interesting finding obtained from
the chart below is not that so many respondents describe their water usage as "above
average" and "below average," but that the majority of respondents categorized their
water usage as "average" or "don't know." That so many of the population are unaware
of their usage may reflect a lack of education and awareness in Indian society as a whole
regarding environmental issues. Such data reemphasize my claim that accepting the vows
does not necessarily make one environmentally responsible. Table 7 represents the
participants' responses from different religious backgrounds regarding the usage of
water.
68