________________
Carbon Footprint of food (incl. methane)
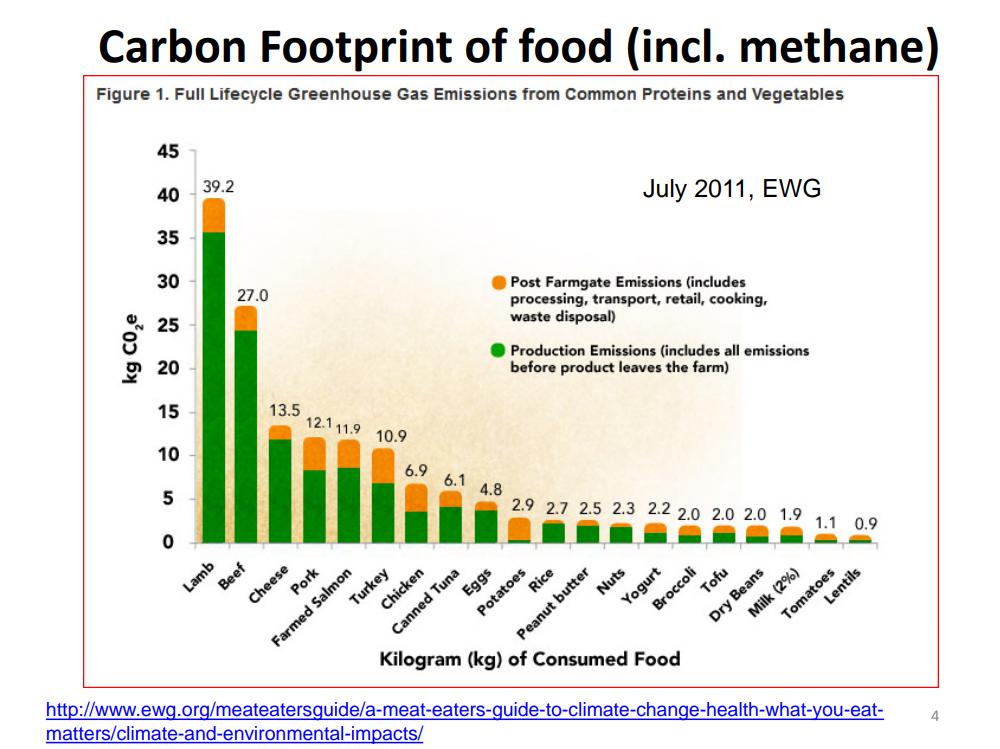
Figure 1. Full Lifecycle Greenhouse Gas Emissions from Common Proteins and Vegetables
kg CO2e
4 3 2 2 50
45
40
35
30
25
20
15
10
39.2
Lamb
27.0
Beef
13.5
Cheese
12.111.9
Pork
10.9
Turkey
Farmed Salmon
6.9 6.1 4.8
Chicken
Canned Tuna
matters/climate-and-environmental-impacts/
Post Farmgate Emissions (includes processing, transport, retail, cooking, waste disposal)
Production Emissions (includes all emissions before product leaves the farm)
Eggs
Potatoes
2.9 2.7 2.5 2.3 2.2 2.0 2.0 2.0 1.9
July 2011, EWG
Rice
Peanut butter
Nuts
Yogurt
Tofu
Broccoli
Dry Beans
Milk (2%)
1.1 0.9
Lentils
Tomatoes
Kilogram (kg) of Consumed Food
http://www.ewg.org/meateatersguide/a-meat-eaters-guide-to-climate-change-health-what-you-eat
4