________________
Jaina Community-A Social Survey
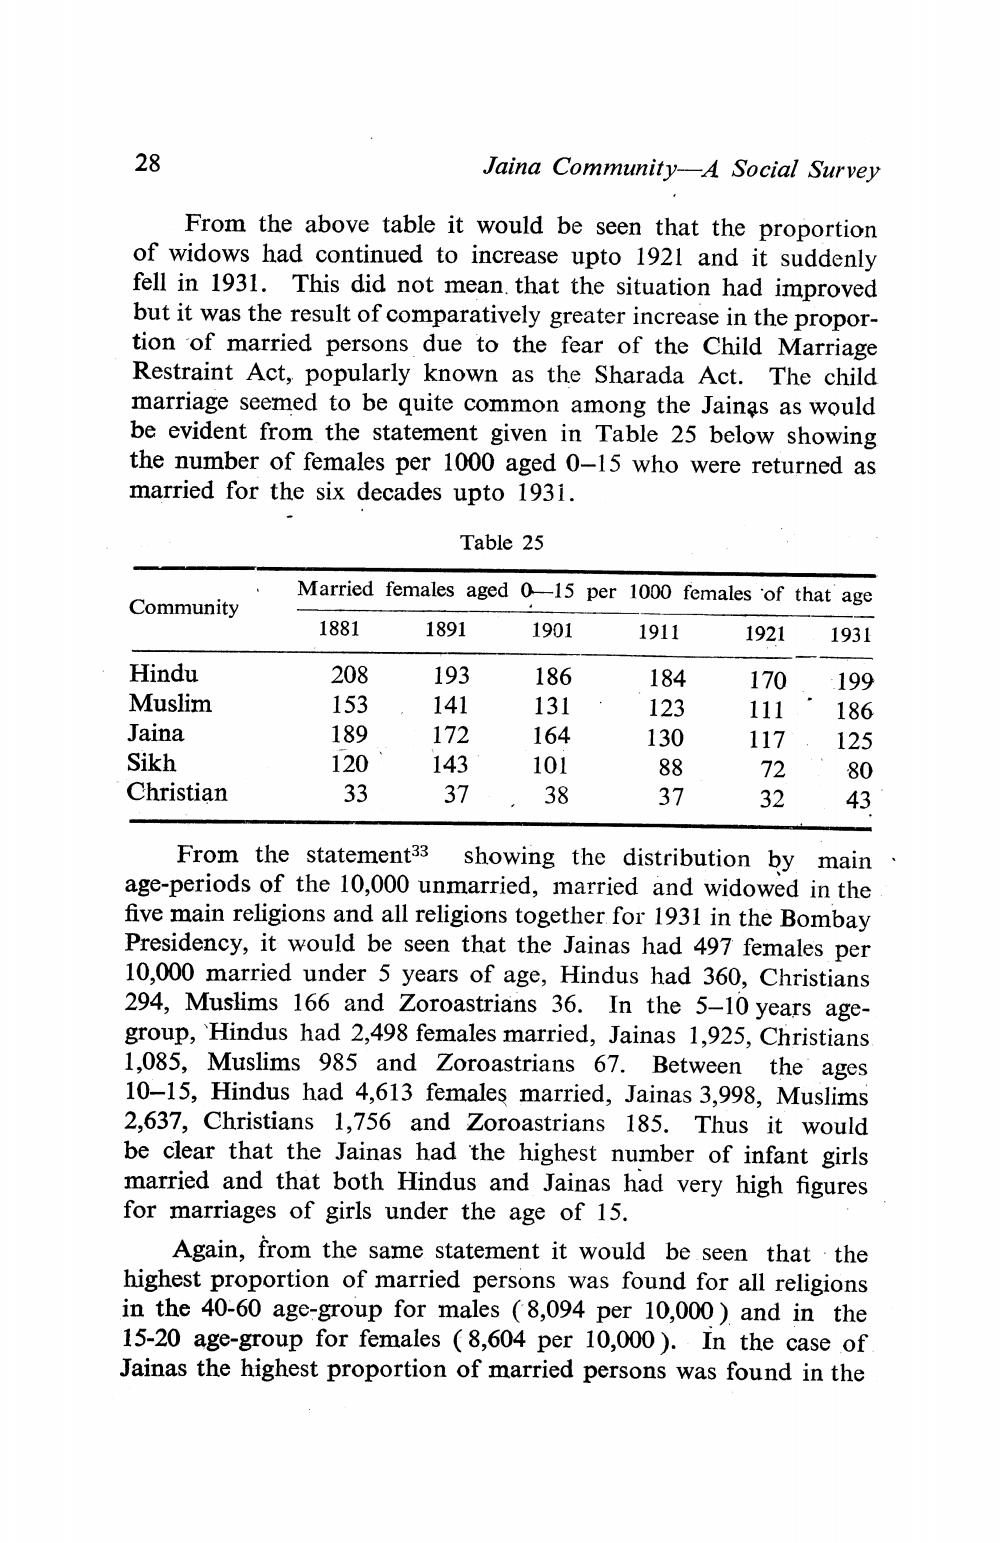
From the above table it would be seen that the proportion of widows had continued to increase upto 1921 and it suddenly fell in 1931. This did not mean that the situation had improved but it was the result of comparatively greater increase in the proportion of married persons due to the fear of the Child Marriage Restraint Act, popularly known as the Sharada Act. The child marriage seemed to be quite common among the Jainas as would be evident from the statement given in Table 25 below showing the number of females per 1000 aged 0-15 who were returned as married for the six decades upto 1931.
Table 25
-
Community
Married females aged a 15 per 1000 females of that age
1881 1891 1901 1911 1921 1931
186
184
131 .
123
Hindu Muslim Jaina Sikh Christian
208 153 189 120 33
193 141 172 143 37
130
170 199 111186 117, 125 72 32 43
88
101 38
37
From the statement33 showing the distribution by main age-periods of the 10,000 unmarried, married and widowed in the five main religions and all religions together for 1931 in the Bombay Presidency, it would be seen that the Jainas had 497 females per 10,000 married under 5 years of age, Hindus had 360, Christians 294, Muslims 166 and Zoroastrians 36. In the 5–10 years agegroup, Hindus had 2,498 females married, Jainas 1,925, Christians 1,085, Muslims 985 and Zoroastrians 67. Between the ages 10–15, Hindus had 4,613 females married, Jainas 3,998, Muslims 2,637, Christians 1,756 and Zoroastrians 185. Thus it would be clear that the Jainas had the highest number of infant girls married and that both Hindus and Jainas had very high figures for marriages of girls under the age of 15.
Again, from the same statement it would be seen that the highest proportion of married persons was found for all religions in the 40-60 age-group for males (8,094 per 10,000) and in the 15-20 age-group for females (8,604 per 10,000). In the case of Jainas the highest proportion of married persons was found in the


