________________
25
Population
Table 21
Community
Sex
.
Number aged 60 and over
Number aged
15—40
-
Percentage of Col. 3 to 4
1
2
5
Tribal
M
Hindu
Muslim
1,23,846 1,39,208 47,82,296 50,44,122 15,47,638 12,77,130
28,276 30,340 1,47,828 1,06,023
3,957 3,730
14,55,660
15,29,419 5,00,89,524 4,83,54,902 1,61,79,065 1,50,11,484
2,66,275 2,46,619 9,63,229 7,19,448
24,150 - 23,348
8.5 9.1
9.5 10.4 9.6 8.5 10.6 12:3 15.3 14.7 16.4 16.0
Jaina
Sikh
Parsi
F
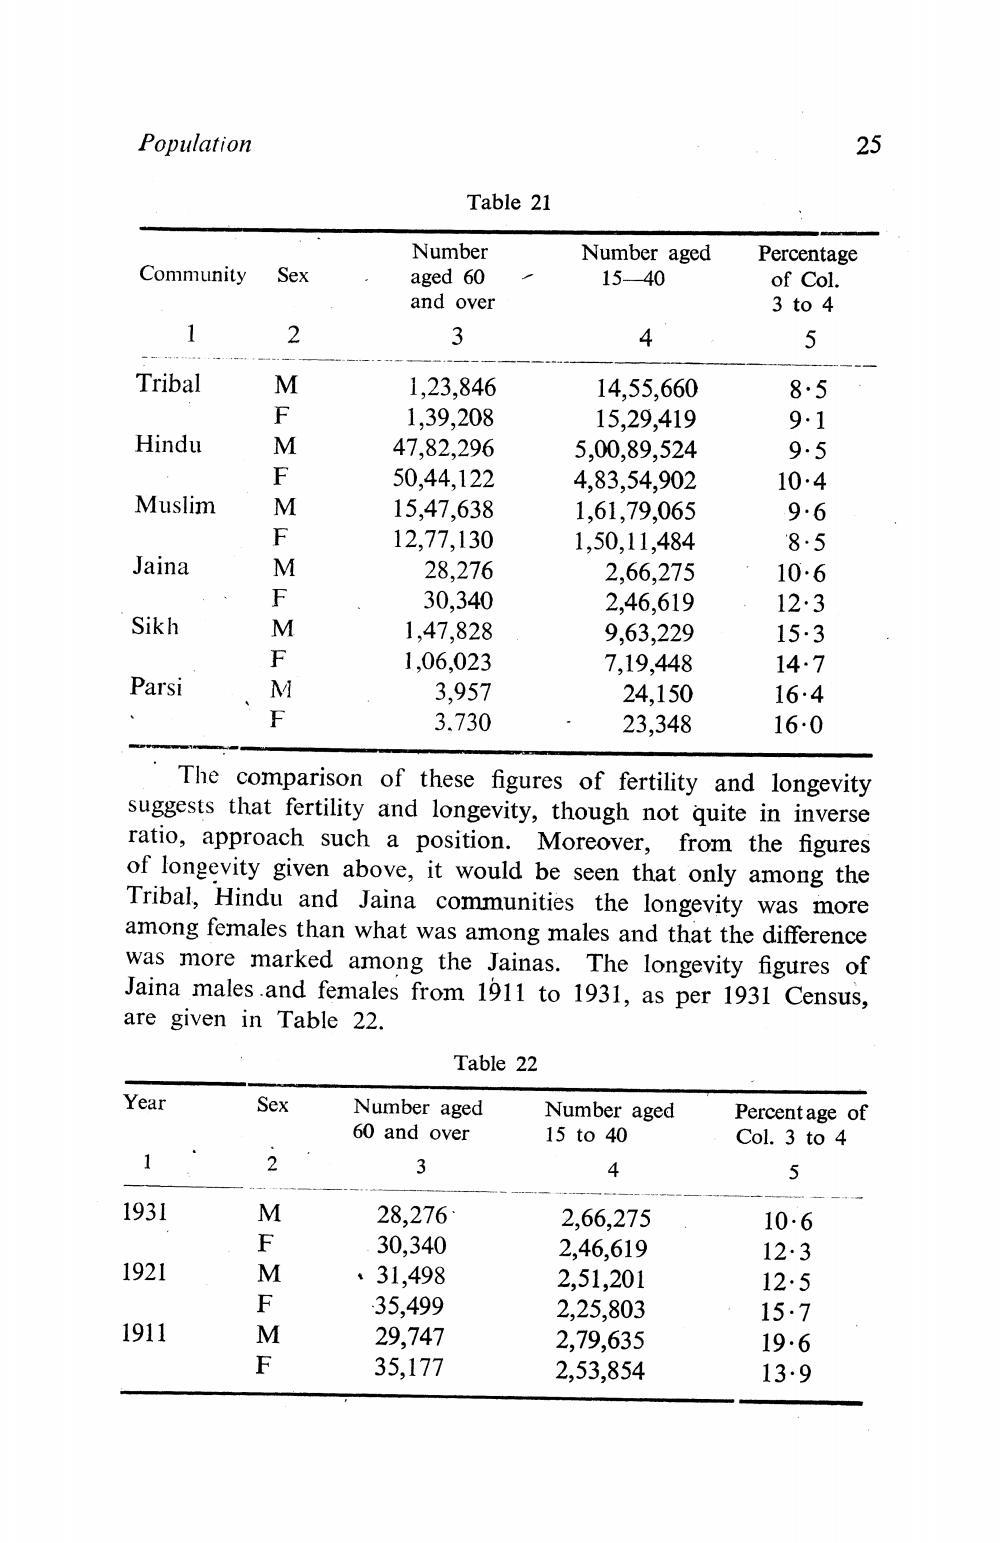
The comparison of these figures of fertility and longevity suggests that fertility and longevity, though not quite in inverse ratio, approach such a position. Moreover, from the figures of longevity given above, it would be seen that only among the Tribal, Hindu and Jaina communities the longevity was more among females than what was among males and that the difference was more marked among the Jainas. The longevity figures of Jaina males and females from 1911 to 1931, as per 1931 Census, are given in Table 22.
Table 22
Year
Sex
Number aged 60 and over
Number aged 15 to 40
4
Percentage of Col. 3 to 4
5
3
1931
1921
28,276 30,340 31,498 35,499 29,747 35,177
2,66,275 2,46,619 2,51,201 2,25,803 2,79,635 2,53,854
10.6 12.3 12.5 15.7 19.6 13.9
1911