________________
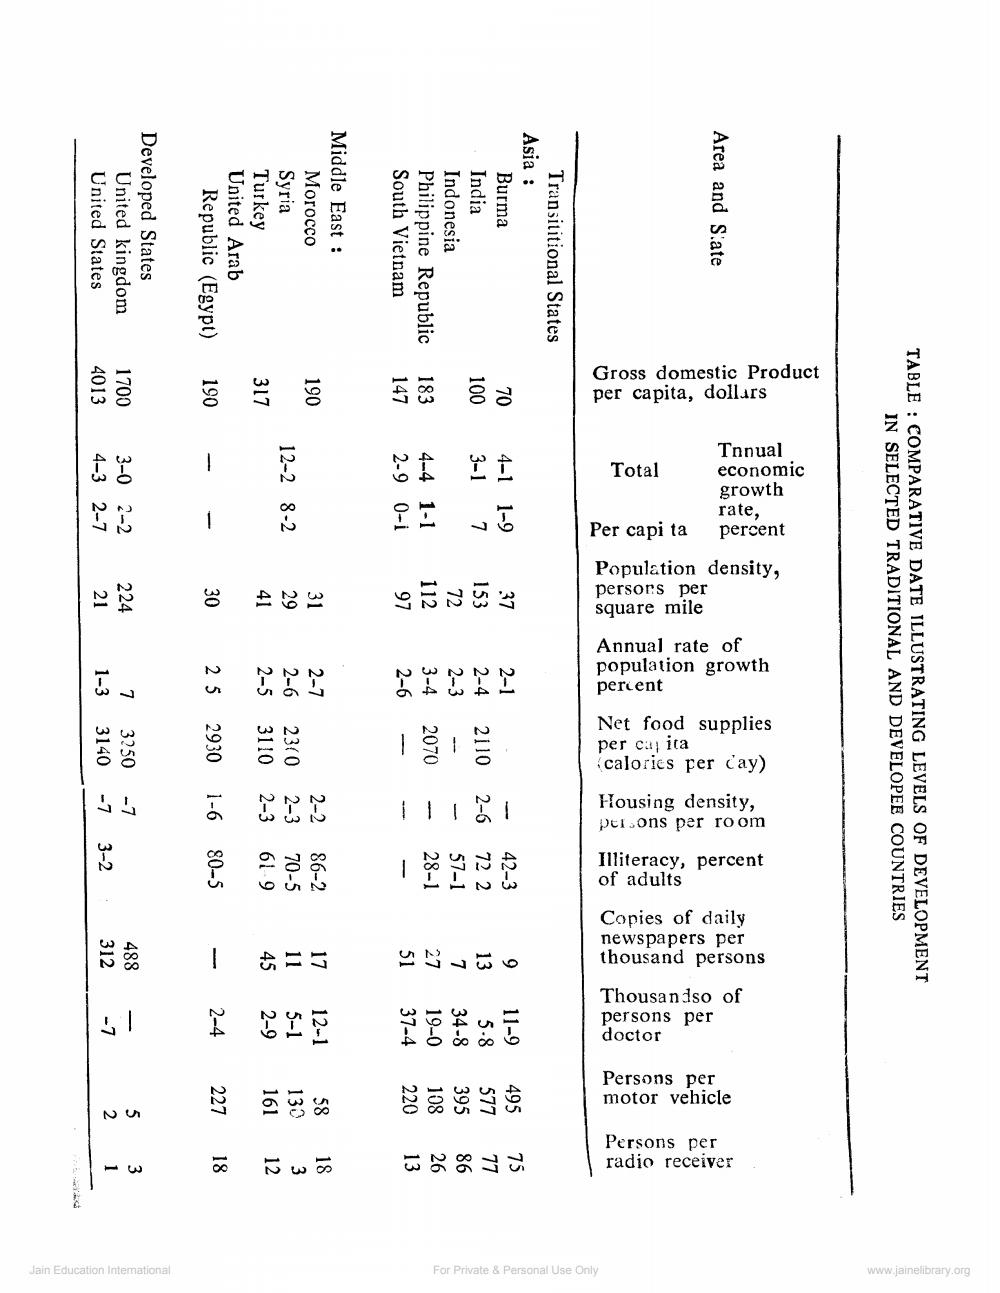
Area and State
Transititional States
Asia :
Burma
India
Indonesia
Philippine Republic South Vietnam
Middle East: Morocco
Syria
Turkey
United Arab
Republic (Egypt)
Developed States
United kingdom
United States
TABLE COMPARATIVE DATE ILLUSTRATING LEVELS OF DEVELOPMENT IN SELECTED TRADITIONAL AND DEVELOPEE COUNTRIES
Gross domestic Product per capita, dollars
70
100
183
147
190
317
190
Tnnual economic growth
rate,
percent
Total
Ï Ì
12
4-1 1-9
Per capi ta
Population density, persors per square mile
5
[2]
7
4-4 1-1
27
I!
2-9 0-i
12-2 8-2
1700 3-0 2-2
4013
4-3 2-7
23225
27
30
224
21
Annual rate of population growth. percent
2-1
2-4 2-3
3-4
2-6
Net food supplies calories per day) per capita
2-7 2-6 23(0 2-5 3110
7
2 5 2930
1-3
13.
11121
Housing density, persons per room
3250
3140
2-2
2-3
2-3
1-6
77
Illiteracy, percent of adults
1
STOS
3-2
Copies of daily newspapers per thousand persons
6
2725
+=3
-
488 312
Thousandso of persons per doctor
12121
272
2-4
15
motor vehicle Persons per
495
577
395
108
220
58
130
161
227
52
radio receiver Persons per
CROEM
∞ m 2
18
31
www.jainelibrary.org
For Private & Personal Use Only
Jain Education International